Exercise 33: Calculating Analysis of Variance
(ANOVA) and Post Hoc Analysis following ANOVA -
SPSS Output (Exercise 33 Student Version)
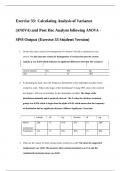
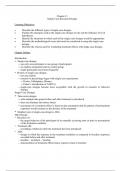
1. Do the data meet criteria for homogeneity of variance? Provide a rationale for your
answer Yes the data met criteria for homogeneity of variance because the Levene
statistic p was 0.455 which indicates no significant differences between the variances
Levene statistic Df1 Df2 Sig.
.821 2 12 .463
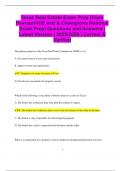
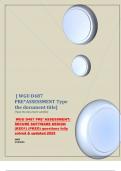
2. If calculating by hand, draw the frequency distribution of the dependent variable, hours
worked at a job. What is the shape of the distribution? If using SPSS, what is the result of
the Shapiro- Wilk test of normality for the dependent variable? The shape of the
distribution unimodal and is positively skewed. The P values for all three treatment
groups was 0.934 which is larger than the alpha of 0.05 which means that the frequency
of distribution had no significant deviance Lilliefors Significance Correction
statistic df Sig. Statistic df Sig.
Hours .209 15 .076 .931 15 .284
worked per
Treatment .215 15 .061 .805 15 .004
week
group
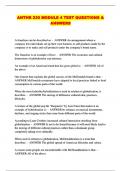
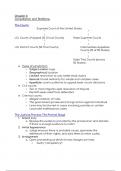
3. What are the means for three groups hours worked on a job? The mean for supported
employment was 14.60. The mean for observational treatment was 15.2 and the
randomized treatment mean was 26.60
(ANOVA) and Post Hoc Analysis following ANOVA -
SPSS Output (Exercise 33 Student Version)
1. Do the data meet criteria for homogeneity of variance? Provide a rationale for your
answer Yes the data met criteria for homogeneity of variance because the Levene
statistic p was 0.455 which indicates no significant differences between the variances
Levene statistic Df1 Df2 Sig.
.821 2 12 .463
2. If calculating by hand, draw the frequency distribution of the dependent variable, hours
worked at a job. What is the shape of the distribution? If using SPSS, what is the result of
the Shapiro- Wilk test of normality for the dependent variable? The shape of the
distribution unimodal and is positively skewed. The P values for all three treatment
groups was 0.934 which is larger than the alpha of 0.05 which means that the frequency
of distribution had no significant deviance Lilliefors Significance Correction
statistic df Sig. Statistic df Sig.
Hours .209 15 .076 .931 15 .284
worked per
Treatment .215 15 .061 .805 15 .004
week
group
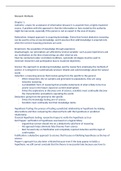
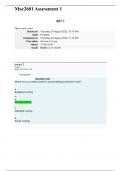
3. What are the means for three groups hours worked on a job? The mean for supported
employment was 14.60. The mean for observational treatment was 15.2 and the
randomized treatment mean was 26.60