Exercise 32: Calculating t-Test for (Paired) Dependent
Samples - SPSS Output (Exercise 32 Student Version)
1. Do the example data meet the assumptions for the paired sample t-test? Provide a rationale
for your answer Yes, all of the data measured is from only one group of individuals with a
normal distribution of scores. The dependent variable is measured at an interval level.
The only difference between the groups is that the paired scores are independent
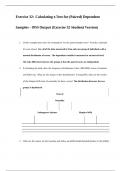
2. If calculating by hand, draw the frequency distributions of the GERD-HRQL scores at baseline
and follow-up. What are the shapes of the distributions? If using SPSS, what are the results
of the Shapiro-Wilk tests of normality for these scores? The distribution between the two
groups is leptokurtic
Tests of
Normality
Kolmogorov-Smirnov Shapiro-Wilk
3. What are the means for the baseline and follow-up GERD Health-Related Quality of Life (HRQL)
Samples - SPSS Output (Exercise 32 Student Version)
1. Do the example data meet the assumptions for the paired sample t-test? Provide a rationale
for your answer Yes, all of the data measured is from only one group of individuals with a
normal distribution of scores. The dependent variable is measured at an interval level.
The only difference between the groups is that the paired scores are independent
2. If calculating by hand, draw the frequency distributions of the GERD-HRQL scores at baseline
and follow-up. What are the shapes of the distributions? If using SPSS, what are the results
of the Shapiro-Wilk tests of normality for these scores? The distribution between the two
groups is leptokurtic
Tests of
Normality
Kolmogorov-Smirnov Shapiro-Wilk
3. What are the means for the baseline and follow-up GERD Health-Related Quality of Life (HRQL)