Exercise 20
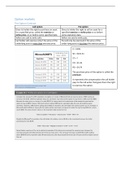
1. How many of the relationships presented in Table 3 of the Li et al. (2014)
study are statistically significant at p < 0.05? Provide a rationale for your answer.
A total of 5 relationships didn’t invite on table 3 are statistically significant at
(p<0.05) as indicated by the * beside the rho value and described in the
footnote of table 3.
2. What two variables from Table 3 have the strongest positive correlation?
Provide a rationale for your answer.
Availability of social support of Emotional Management with the strongest
positive correlation; rho= 0.440 at p < 0.01 because the rho value closer to +
1, where positive value indicates a positive relationship.
3. What do the results in Question 2 mean? How might this information be used
clinically in caring for patients on hemodialysis?
The relationship indicate that as an increase of availability of social support;
the emotional support management also increases. This information can be
, used clinically in caring for patients on hemodialysis by increasing the
availability of social support may improve their over all emotional support
management.
4. What two variables from Table 3 have the strongest negative relationship?
Depression and partnership have the strongest negative relationship with rho
value of −0.429**.
5. What do the results in Question 4 mean? How might this information be used
clinically in caring for patients on hemodialysis?
The results in Question 4 indicate as an increase in partnership leads to
decrease in depression. The negative sign indicates inverse or negative
direction of the relationship. It is the higher negative value, the value closer to
– 1. This information is clinically important because health care personnel
would probably work harder to improve partnership, which would lead to a
decrease in depression among patients on hemodialysis.