Parameter – numerical descriptive measure of a population (Greek letters)
Statistic – numerical summary of a sample (regular letters)
Sampling distribution of a statistic – probability distribution of the stat that contains
all possible samples of a given size
Sample 5 people, find average then sample another 5 and find average, etc.
(sampling distribution is every sample, every combo; see intro video)
Describes long-run behavior of the stat
All statistics have sampling distributions
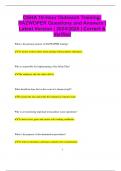
Three different distributions:
Population distribution – almost never observed b/c too big; goal is to look at
sample and learn about population
Sample distribution – aka data distribution; consists of sample data you
actually observe/analyze; should roughly resemble population if random sampling
(one single sample)
Sampling distribution – describes how a statistic varies if random samples are
repeatedly taken from the population (every possible sample and average)
Behave very differently from population or sample distribution (CLT)
Sampling Distribution of x-bar sample mean
X bar is the mean of observations in SRS of size n from a population with mean
u and std dev o
Mean of x bar is equal to the mean of the population u of x bar = u
(Check PowerPoint)
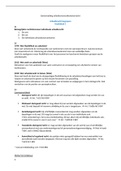
CLT:
As sample size n increases, sampling distribution approaches a standard normal
distribution, regardless of the shape of the population distribution
CLT Assumptions:
Randomization condition, independence, sample cannot be more than 10% population
(10% condition), large enough sample condition
If pop. Unimodal and symmetric then tiny sample okay
If skewed we need large sample
, Point estimate: using stat to estimate a parameter
-Unbiased (centered around population mean)
-Small standard deviation
Use x bar to estimate population mean
Using p hat to estimate p
Using s (sample std dev) to estimate sigma
Sample Population
Statistic does NOT equal parameter due to sampling variability
Interval estimates/CI – must give measure of sampling error with all point estimates
CI = point estimate +/- margin of error
Margin of error depends on standard error and is a measure of sampling error
Margin of error is ½ width of the confidence interval
% of confidence is determined by the % in the symmetric interval about the mean
CI either captures true population parameter, or it does not (NOT a probability)
One-proportion z-interval
Check assumptions: data obtained by randomization
Np 15 and n(1-p) 15
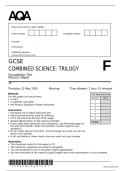
Toss a coin 40 times and it lands on heads 16 times.
Point estimate: # of successes/total = 16/40 = .40
p hat = .4 and p hat =.077 CHECK ASSUMPTIONS
Use normal calculator on StatCrunch
Use standard normal curve and formula
Have StatCrunch compute confidence interval
Find P(x ____) = .05 90% CI
Find P(x ____) = .05 90% CI = (0.273, 0.527)
Stats proportion 1 sample with summary
Statistic – numerical summary of a sample (regular letters)
Sampling distribution of a statistic – probability distribution of the stat that contains
all possible samples of a given size
Sample 5 people, find average then sample another 5 and find average, etc.
(sampling distribution is every sample, every combo; see intro video)
Describes long-run behavior of the stat
All statistics have sampling distributions
Three different distributions:
Population distribution – almost never observed b/c too big; goal is to look at
sample and learn about population
Sample distribution – aka data distribution; consists of sample data you
actually observe/analyze; should roughly resemble population if random sampling
(one single sample)
Sampling distribution – describes how a statistic varies if random samples are
repeatedly taken from the population (every possible sample and average)
Behave very differently from population or sample distribution (CLT)
Sampling Distribution of x-bar sample mean
X bar is the mean of observations in SRS of size n from a population with mean
u and std dev o
Mean of x bar is equal to the mean of the population u of x bar = u
(Check PowerPoint)
CLT:
As sample size n increases, sampling distribution approaches a standard normal
distribution, regardless of the shape of the population distribution
CLT Assumptions:
Randomization condition, independence, sample cannot be more than 10% population
(10% condition), large enough sample condition
If pop. Unimodal and symmetric then tiny sample okay
If skewed we need large sample
, Point estimate: using stat to estimate a parameter
-Unbiased (centered around population mean)
-Small standard deviation
Use x bar to estimate population mean
Using p hat to estimate p
Using s (sample std dev) to estimate sigma
Sample Population
Statistic does NOT equal parameter due to sampling variability
Interval estimates/CI – must give measure of sampling error with all point estimates
CI = point estimate +/- margin of error
Margin of error depends on standard error and is a measure of sampling error
Margin of error is ½ width of the confidence interval
% of confidence is determined by the % in the symmetric interval about the mean
CI either captures true population parameter, or it does not (NOT a probability)
One-proportion z-interval
Check assumptions: data obtained by randomization
Np 15 and n(1-p) 15
Toss a coin 40 times and it lands on heads 16 times.
Point estimate: # of successes/total = 16/40 = .40
p hat = .4 and p hat =.077 CHECK ASSUMPTIONS
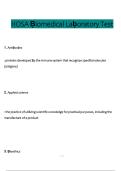
Use normal calculator on StatCrunch
Use standard normal curve and formula
Have StatCrunch compute confidence interval
Find P(x ____) = .05 90% CI
Find P(x ____) = .05 90% CI = (0.273, 0.527)
Stats proportion 1 sample with summary