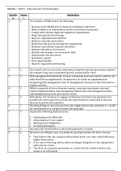
MGSC 291 Graphical Displays
a type of graph used to display patterns of quantitative data. great for side by side comparisons.
shows the 5 number summary - ANS-boxplot
diagram that works for medium to large datasets. each bin touches the next. the choice of
number of bins can distort features of the shape of the distribution. good graph for showing the
shape of data - ANS-histogram
diagram that displays quantitive data changing over time. time on horizontal axis, variable on
vertical axis. use different lines to denote different categories or groups - ANS-line graph
diagram for categorical (qualitative data). can be horizontal or vertical. can display parts of a
whole or separate values. for nominal put bars in descending order. for ordinal put bars in order
of categories - ANS-bar graph
display used fro categorical (qualitative) data. displays parts of a whole. not good when there
are a lot of categories. not good for comparisons - ANS-pie charts
used to depict two potentially related variables. each point is a pairing, could be linear,
curvilinear or no relationship, can have positive or negative relationship - ANS-scatterplot