Inhoudsopgave
Week 1...............................................................................................................................1
Week 2...............................................................................................................................3
Week 3..............................................................................................................................10
Week 4..............................................................................................................................12
Week 5..............................................................................................................................18
Week 6..............................................................................................................................22
Week 7..............................................................................................................................25
Week 1
1) Central tendency: where the midpoint of a variable is. (mode, median & mean)
2) Dispersion: how are the scores spread around that midpoint (widely or closed
spread) (Range, IQR & standard devation). Also measure of variability.
3) Shape: how does the distribution of variables look like (bell-shape for example)
Mode: most frequently
Median: Middle score when all the data is ordered from low to high. Only useful when the
scores of a variable range from low to high. So only useful for ordinal, interval or ratio level.
50% of the scores lie higher and lower.
Range: highest score- lowest score
Inter quartile range: 25% of the observations above the median, 25% of the observations
below the median. This gives you the middle 50% of the observations.
Qu= upper quartile (75%)
1
,QL= lower quartile (25%)
Median= middle quartile (50%)
Skewed: median & IQR. Symmetric: mean& standard deviation
Standard deviation: average difference between the scores and the mean. How well the
mean represents the sample data. How representative the mean is of the observed data. A
small standard deviation represented a scenario in which most data points were close to the
mean, whereas a large standard deviation represented a situation in which data points were
widely spread from the mean.
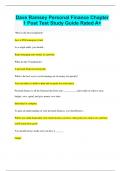
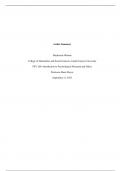
the dispersion of an interval or ratio
variable can be interpreted using
the empirical rule or the
chebychev’s rule.
Empirical rule:
bell-shape or symmetric, a normal
distribution
2
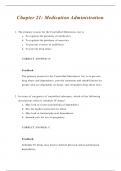
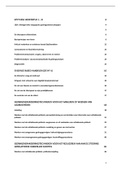
,Chebychev’s rule: applicable to all
distribution, so also when it is not
symmetric or skewed, or a normal
distribution. The interpretation is
different about the percentages:
- Difficult to determine the
percentages.
The choice between one of those two depends on:
- Related to the shape of the distribution
1) Symmetric empirical rule is most adequate
option
2) Skweded chebychev’s rule is the most
adequate one
Chebychevs= at least
empirical rule= around
Z-score: relative position, distance in terms of standard deviation. So this can only be
calculated for interval and ratio variables. z-score: how many standard deviations an
observation is away from the mean (u).
2 advantages of z-score:
- Compare different relative positions across different variables, because they are all in
terms of standard divisions
- Be used to find specific surface areas under a curve, used for calculating probabilities
(confidence intervals and hypothesis testing)
Week 2
3
, Two types of random variables:
Discrete random variable:
- Integers numbers (=whole numbers, no fraction: 2 kids, not 2,5)
- Finite (eindig) number of values
- These have nominal distributions
Continuous random variable:
- Integers or decimal numbers (fractional numbers)
- Infinite number of values in a certain interval
- These have z-values and normal distributions
Standard normal distribution characteristics:
- Probability under the whole distribution is in
total 1 or 100%. Due to rounding it can be
99,8%
- It Is symmetric (50% of the score below and
above the mean). As a result. The chance
finding a score above the mean is 50% and vice
versa.
- The percentages between mean and X standard
deviation
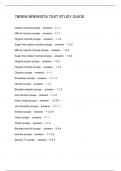
To be able to use the probabilities from a normal distribution the variable and the score must
be converted in a standard normal distribution. To achieve that is to calculate Z scores:
Refers to the number of standard deviations a specific score is
deviated from the mean.
When the outcome is -2, the score lies 2 standard deviations
below the mean.
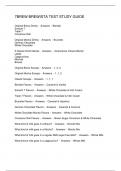
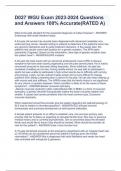
Classical z-table: the mean is 219.70 seconds. The standard
deviation is 74,98. What is the probability that I will find a sing
that lasts more than 300 seconds?
3577 is the probability that you find a score from the mean up to
and including a z score of 1.07. Therefore, the area of a z score
of 1.07 and higher: .5-.3577=.1423
Table divided into the smaller and the larger portion:
.1423 is the chance to find a z-score of 1.07 or bigger (or -1.07 or
smaller).
The pattern: the larger the z score, the
smaller the probability for finding that z score or bigger.
4
Week 1...............................................................................................................................1
Week 2...............................................................................................................................3
Week 3..............................................................................................................................10
Week 4..............................................................................................................................12
Week 5..............................................................................................................................18
Week 6..............................................................................................................................22
Week 7..............................................................................................................................25
Week 1
1) Central tendency: where the midpoint of a variable is. (mode, median & mean)
2) Dispersion: how are the scores spread around that midpoint (widely or closed
spread) (Range, IQR & standard devation). Also measure of variability.
3) Shape: how does the distribution of variables look like (bell-shape for example)
Mode: most frequently
Median: Middle score when all the data is ordered from low to high. Only useful when the
scores of a variable range from low to high. So only useful for ordinal, interval or ratio level.
50% of the scores lie higher and lower.
Range: highest score- lowest score
Inter quartile range: 25% of the observations above the median, 25% of the observations
below the median. This gives you the middle 50% of the observations.
Qu= upper quartile (75%)
1
,QL= lower quartile (25%)
Median= middle quartile (50%)
Skewed: median & IQR. Symmetric: mean& standard deviation
Standard deviation: average difference between the scores and the mean. How well the
mean represents the sample data. How representative the mean is of the observed data. A
small standard deviation represented a scenario in which most data points were close to the
mean, whereas a large standard deviation represented a situation in which data points were
widely spread from the mean.
the dispersion of an interval or ratio
variable can be interpreted using
the empirical rule or the
chebychev’s rule.
Empirical rule:
bell-shape or symmetric, a normal
distribution
2
,Chebychev’s rule: applicable to all
distribution, so also when it is not
symmetric or skewed, or a normal
distribution. The interpretation is
different about the percentages:
- Difficult to determine the
percentages.
The choice between one of those two depends on:
- Related to the shape of the distribution
1) Symmetric empirical rule is most adequate
option
2) Skweded chebychev’s rule is the most
adequate one
Chebychevs= at least
empirical rule= around
Z-score: relative position, distance in terms of standard deviation. So this can only be
calculated for interval and ratio variables. z-score: how many standard deviations an
observation is away from the mean (u).
2 advantages of z-score:
- Compare different relative positions across different variables, because they are all in
terms of standard divisions
- Be used to find specific surface areas under a curve, used for calculating probabilities
(confidence intervals and hypothesis testing)
Week 2
3
, Two types of random variables:
Discrete random variable:
- Integers numbers (=whole numbers, no fraction: 2 kids, not 2,5)
- Finite (eindig) number of values
- These have nominal distributions
Continuous random variable:
- Integers or decimal numbers (fractional numbers)
- Infinite number of values in a certain interval
- These have z-values and normal distributions
Standard normal distribution characteristics:
- Probability under the whole distribution is in
total 1 or 100%. Due to rounding it can be
99,8%
- It Is symmetric (50% of the score below and
above the mean). As a result. The chance
finding a score above the mean is 50% and vice
versa.
- The percentages between mean and X standard
deviation
To be able to use the probabilities from a normal distribution the variable and the score must
be converted in a standard normal distribution. To achieve that is to calculate Z scores:
Refers to the number of standard deviations a specific score is
deviated from the mean.
When the outcome is -2, the score lies 2 standard deviations
below the mean.
Classical z-table: the mean is 219.70 seconds. The standard
deviation is 74,98. What is the probability that I will find a sing
that lasts more than 300 seconds?
3577 is the probability that you find a score from the mean up to
and including a z score of 1.07. Therefore, the area of a z score
of 1.07 and higher: .5-.3577=.1423
Table divided into the smaller and the larger portion:
.1423 is the chance to find a z-score of 1.07 or bigger (or -1.07 or
smaller).
The pattern: the larger the z score, the
smaller the probability for finding that z score or bigger.
4