STA3701
Machuene Elias Mabetoa
2024-07-19
# Load necessary packages
library(faraway)
## Warning: package 'faraway' was built under R version 4.3.3
library(car) # For VIF calculation
## Warning: package 'car' was built under R version 4.3.2
## Loading required package: carData
## Warning: package 'carData' was built under R version 4.3.2
##
## Attaching package: 'car'
## The following objects are masked from 'package:faraway':
##
## logit, vif
library(MASS) # For Box-Cox transformation
library(ggplot2) # For plotting
# Load the dataset
data(fat)
###1.1 Purpose of the Study The purpose of this study is to determine the relationship
between body fat percentage (measured by the Brozek formula) and various body
measurements, age, height, and weight among a sample of 252 men.
1.2 Percentage of Variation Explained
• The R-squared value is approximately 0.970, which means that about 97% of the
variation in body fat percentage (Brozek) is explained by the predictors in the
model.
# Fit the initial model
model <- lm(brozek ~ . - siri - density, data = fat)
summary_model <- summary(model)
r_squared <- summary_model$r.squared
# Output R-squared
print(r_squared)
## [1] 0.9700398
,1.3
Based on the purpose of the study, we are examining the relationship between body fat
percentage and various predictors: body measurements, age, height, and weight. To
determine if there are signs of multicollinearity, we would look for:
High Correlations Among Predictors: If body measurements (e.g., waist circumference, hip
circumference), age, height, and weight are highly correlated with each other, it might
indicate multicollinearity. For example, height and weight often have a high correlation,
which could lead to multicollinearity.
Variance Inflation Factors (VIFs): If we have computed VIFs for our predictors, values
greater than 10 (or sometimes 5, depending on the threshold used) would suggest
multicollinearity.
Condition Index: A high condition index (e.g., above 30) indicates multicollinearity issues.
Without specific data on the correlations or VIFs, it’s hard to definitively say if
multicollinearity is present. However, if we observe that some of our predictor variables
are highly correlated with each other, or if VIFs and condition indices indicate high
multicollinearity, then your model might have multicollinearity issues.
1.4 Multicollinearity Diagnostics
Multicollinearity in the Model:
To detect multicollinearity, we will use several diagnostics: condition numbers, scatterplot
and pairwise correlation matrices, and variance inflation factors (VIF).
# (a) Condition Numbers
condition_numbers <- kappa(model, exact = TRUE)
print(condition_numbers)
## [1] 20167.94
Condition numbers help to determine the degree of multicollinearity in the model. A
condition number greater than 30 suggests moderate to severe multicollinearity.
-A condition number of 20167.94 indicates severe multicollinearity in the model.
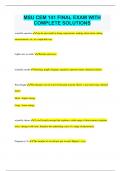
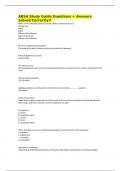
# (b) Scatterplot and Pairwise Correlation Matrices
# Adjust margins and plot the scatterplot matrix
op <- par(mar = c(1, 1, 1, 1))
pairs(fat[ , !(names(fat) %in% c("brozek", "siri", "density"))])
, par(op) # Reset to original parameters
The scatterplot matrix visualizes pairwise relationships between each pair of variables in
the dataset. Each cell in the matrix contains a scatterplot of two variables, with the
variables’ names labeled along the diagonal. The plots can help identify patterns,
relationships, and potential multicollinearity among the variables.
Here is a brief interpretation of the scatterplot matrix:
Diagonal Elements: Each diagonal element represents the distribution of a single variable,
often shown as a histogram or density plot. These plots give a sense of the univariate
distribution of each variable.
Off-Diagonal Elements: These scatterplots show the relationship between pairs of
variables:
Linear Relationships: Variables with linear relationships will show a clear, straight pattern
in their corresponding scatterplot. For example, the scatterplots involving weight, adipos,
chest, abdom, and hip show strong linear relationships, indicating potential
multicollinearity. Clustered Patterns: If points are clustered tightly around a line, it
indicates a strong relationship. Loose and spread-out points suggest weaker relationships.
Outliers: Points that fall far from the main cloud of data can indicate outliers, which might
need special consideration in the analysis. Identifying Multicollinearity:
High Correlations: Pairs of variables with high correlations (visible as tightly clustered
points along a line) suggest multicollinearity. For example, the scatterplots for weight
Machuene Elias Mabetoa
2024-07-19
# Load necessary packages
library(faraway)
## Warning: package 'faraway' was built under R version 4.3.3
library(car) # For VIF calculation
## Warning: package 'car' was built under R version 4.3.2
## Loading required package: carData
## Warning: package 'carData' was built under R version 4.3.2
##
## Attaching package: 'car'
## The following objects are masked from 'package:faraway':
##
## logit, vif
library(MASS) # For Box-Cox transformation
library(ggplot2) # For plotting
# Load the dataset
data(fat)
###1.1 Purpose of the Study The purpose of this study is to determine the relationship
between body fat percentage (measured by the Brozek formula) and various body
measurements, age, height, and weight among a sample of 252 men.
1.2 Percentage of Variation Explained
• The R-squared value is approximately 0.970, which means that about 97% of the
variation in body fat percentage (Brozek) is explained by the predictors in the
model.
# Fit the initial model
model <- lm(brozek ~ . - siri - density, data = fat)
summary_model <- summary(model)
r_squared <- summary_model$r.squared
# Output R-squared
print(r_squared)
## [1] 0.9700398
,1.3
Based on the purpose of the study, we are examining the relationship between body fat
percentage and various predictors: body measurements, age, height, and weight. To
determine if there are signs of multicollinearity, we would look for:
High Correlations Among Predictors: If body measurements (e.g., waist circumference, hip
circumference), age, height, and weight are highly correlated with each other, it might
indicate multicollinearity. For example, height and weight often have a high correlation,
which could lead to multicollinearity.
Variance Inflation Factors (VIFs): If we have computed VIFs for our predictors, values
greater than 10 (or sometimes 5, depending on the threshold used) would suggest
multicollinearity.
Condition Index: A high condition index (e.g., above 30) indicates multicollinearity issues.
Without specific data on the correlations or VIFs, it’s hard to definitively say if
multicollinearity is present. However, if we observe that some of our predictor variables
are highly correlated with each other, or if VIFs and condition indices indicate high
multicollinearity, then your model might have multicollinearity issues.
1.4 Multicollinearity Diagnostics
Multicollinearity in the Model:
To detect multicollinearity, we will use several diagnostics: condition numbers, scatterplot
and pairwise correlation matrices, and variance inflation factors (VIF).
# (a) Condition Numbers
condition_numbers <- kappa(model, exact = TRUE)
print(condition_numbers)
## [1] 20167.94
Condition numbers help to determine the degree of multicollinearity in the model. A
condition number greater than 30 suggests moderate to severe multicollinearity.
-A condition number of 20167.94 indicates severe multicollinearity in the model.
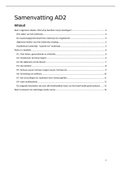
# (b) Scatterplot and Pairwise Correlation Matrices
# Adjust margins and plot the scatterplot matrix
op <- par(mar = c(1, 1, 1, 1))
pairs(fat[ , !(names(fat) %in% c("brozek", "siri", "density"))])
, par(op) # Reset to original parameters
The scatterplot matrix visualizes pairwise relationships between each pair of variables in
the dataset. Each cell in the matrix contains a scatterplot of two variables, with the
variables’ names labeled along the diagonal. The plots can help identify patterns,
relationships, and potential multicollinearity among the variables.
Here is a brief interpretation of the scatterplot matrix:
Diagonal Elements: Each diagonal element represents the distribution of a single variable,
often shown as a histogram or density plot. These plots give a sense of the univariate
distribution of each variable.
Off-Diagonal Elements: These scatterplots show the relationship between pairs of
variables:
Linear Relationships: Variables with linear relationships will show a clear, straight pattern
in their corresponding scatterplot. For example, the scatterplots involving weight, adipos,
chest, abdom, and hip show strong linear relationships, indicating potential
multicollinearity. Clustered Patterns: If points are clustered tightly around a line, it
indicates a strong relationship. Loose and spread-out points suggest weaker relationships.
Outliers: Points that fall far from the main cloud of data can indicate outliers, which might
need special consideration in the analysis. Identifying Multicollinearity:
High Correlations: Pairs of variables with high correlations (visible as tightly clustered
points along a line) suggest multicollinearity. For example, the scatterplots for weight