Correlational Research Methods
Inhoudsopgave
Correlational Research Methods ...................................................................................................................... 1
Lecture 1 – 28/08/2018 ...................................................................................................................................... 3
Null hypothesis significance testing ............................................................................................................... 3
Pearson’s Correlation Coefficient ................................................................................................................... 4
Inferential statistics ........................................................................................................................................ 4
P-Value ........................................................................................................................................................... 4
Lecture 2 – 03/09/2018 ...................................................................................................................................... 4
Inferential statistics ........................................................................................................................................ 4
Confidence interval for r ................................................................................................................................ 5
Assumptions for r ........................................................................................................................................... 5
Power ............................................................................................................................................................. 5
Squared Correlation: r2XY ................................................................................................................................ 5
“Explanations” for the relationship between x and y: ................................................................................... 6
Simple linear regression analysis .................................................................................................................... 6
The linear simple regression model ............................................................................................................... 6
Simple regression analysis .............................................................................................................................. 6
Lecture 3 – 10/09/2018 ...................................................................................................................................... 7
Regression analysis ......................................................................................................................................... 7
Two ways to interpret Y’ ................................................................................................................................ 7
Interpretation regression coefficient b^1 ....................................................................................................... 7
Standardized regression coefficient () ......................................................................................................... 7
Interpretation unstandardized regression coefficient b^1: ........................................................................... 7
Interpretation standardized regression coefficient ^1:................................................................................ 7
Use b ............................................................................................................................................................... 7
Use .............................................................................................................................................................. 7
Sum of squares ............................................................................................................................................... 8
Lecture 4 – 17/09/2018 ...................................................................................................................................... 8
Multiple regression ........................................................................................................................................ 8
Multiple Regression analysis .......................................................................................................................... 8
What do we need to know? ........................................................................................................................... 8
The Linear Multiple Regression model ........................................................................................................... 8
Partial slopes .................................................................................................................................................. 9
Main questions Multiple Regression analysis ................................................................................................ 9
Lecture 5 – 24/09/2018 ...................................................................................................................................... 9
Proportion explained variance ....................................................................................................................... 9
F-Test for the entire model ............................................................................................................................ 9
3. How well does every predictor explain/predict separately? .................................................................... 10
What happens with the explained variance if I remove a predictor? .......................................................... 10
.......................................................................................................................................................................... 11
4. Which predictor is the most important one? ........................................................................................... 12
Lecture 6 – 1/10/2018 ...................................................................................................................................... 12
Hypothesis Testing versus Estimating .......................................................................................................... 12
Multiple Linear Regression Analysis: Starting Point ..................................................................................... 12
Using Multiple regression for ....................................................................................................................... 13
Uniquely explained variance ........................................................................................................................ 13
Lecture 7 – 08/10/2018 .................................................................................................................................... 14
1
, Model with k predictors: Standard Regression Analysis .............................................................................. 14
Adjusted R-square ........................................................................................................................................ 14
Controlling for confounders ......................................................................................................................... 14
Nested models.............................................................................................................................................. 14
What do we use nested model for? ............................................................................................................. 14
Test statistic F ............................................................................................................................................... 14
Hierarchical Regression analysis................................................................................................................... 15
Lecture 8 – 23/10/2018 .................................................................................................................................... 15
Multiple Regression with Dummy variables ................................................................................................. 15
Dummies ...................................................................................................................................................... 15
Categorical values......................................................................................................................................... 15
R-square ....................................................................................................................................................... 16
Dummy Coding ............................................................................................................................................. 16
Lecture 9 – 30/10/2018 .................................................................................................................................... 16
Interaction .................................................................................................................................................... 16
Conceptual Model with an Interaction Effect .............................................................................................. 16
Interpreting main effects in the presence of interaction effects ................................................................. 17
Simple effects ............................................................................................................................................... 17
Lecture 10 – 6/11/2018 .................................................................................................................................... 17
Moderator versus Mediator and Common Cause ........................................................................................ 18
MR with Interaction between Quantitative Variables ................................................................................. 18
Interpretation of centered scores ................................................................................................................ 18
Interpreting the significance of interactions: “Probing” .............................................................................. 18
Multicollinearity ........................................................................................................................................... 18
Variance Inflation Factor (VIF) ...................................................................................................................... 19
Lecture 11 – 13/11/2018 .................................................................................................................................. 20
Overview of statistical techniques ............................................................................................................... 20
Binary Logistic Regression ............................................................................................................................ 20
Determine Logistic Function in Empirical Data ............................................................................................ 21
From probabilities to Odds ........................................................................................................................... 21
From Odds to Logit ....................................................................................................................................... 22
The corresponding function for the Logit..................................................................................................... 22
Lecture 12 – 20/11/2018 .................................................................................................................................. 22
Significance testing ....................................................................................................................................... 22
Pseudo R-square Measures .......................................................................................................................... 23
Classification tables ...................................................................................................................................... 23
Lecture 13 – 27/11/2018 .................................................................................................................................. 24
Q&A .............................................................................................................................................................. 24
2
, Lecture 1 – 28/08/2018
Exam = Multiple choice questions
+ Bonus tutorial quizzes
▪ Simple random sampling
Every member in the population has an equal chance to be sampled
▪ Stratified sampling
The population is divided into strata (e.g., based on gender, age); within each stratum a
random sample is drawn
▪ Convenience sampling
Sample of people who are readily available (e.g., people who are present in the cafeteria,
family and friends of the researcher, first year psychology students)
Descriptive statistics: summarizing data
- Measures of central tendency
o Mean
o Median: the score that separated the higher half of data from the lower half
o Mode: the score that is observed most frequently
- Measures of dispersion
o Variance
o Standard deviation
Inferential statistics: if we want to make generalization about the population, descriptive statistics of
the sample are not enough. We use inferential statistics to draw conclusions about the population,
based on the information from the sample.
- Null hypothesis significance testing
- Confidence interval estimation
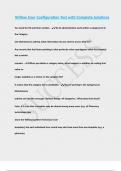
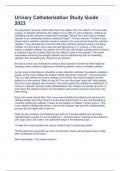
Null hypothesis significance testing
1. We formulate the null and alternative hypothesis
H0: = 6.0
H1: 6.0
2. We make a decision-rule
If the P-value < Alpha, we reject the null hypothesis
3. We obtain the T- and P-value from the output
→ Sig. (2-tailed) = two-tailed P value
4. We either reject of keep the null hypothesis and draw
conclusions
We keep the null hypothesis, because P > .05. We do not
have enough evidence to conclude that the average
exam score in the population does not equal 6.0.
Higher than Alpha or lower than Alpha → Reject
It’s very unlikely that it’s correct
Hence accept H1 as opposed to H0
95% Confidence Interval of the Difference
→ we can say with 95% certainty that lies between … and …
Definition: when we carry out an experiment over and over again, the 95% confidence interval will
contain the real value of the parameter of interest (e.g., ) in 95% of the cases.
Interpretation: based on the data, this range of values probably contains .
3
Inhoudsopgave
Correlational Research Methods ...................................................................................................................... 1
Lecture 1 – 28/08/2018 ...................................................................................................................................... 3
Null hypothesis significance testing ............................................................................................................... 3
Pearson’s Correlation Coefficient ................................................................................................................... 4
Inferential statistics ........................................................................................................................................ 4
P-Value ........................................................................................................................................................... 4
Lecture 2 – 03/09/2018 ...................................................................................................................................... 4
Inferential statistics ........................................................................................................................................ 4
Confidence interval for r ................................................................................................................................ 5
Assumptions for r ........................................................................................................................................... 5
Power ............................................................................................................................................................. 5
Squared Correlation: r2XY ................................................................................................................................ 5
“Explanations” for the relationship between x and y: ................................................................................... 6
Simple linear regression analysis .................................................................................................................... 6
The linear simple regression model ............................................................................................................... 6
Simple regression analysis .............................................................................................................................. 6
Lecture 3 – 10/09/2018 ...................................................................................................................................... 7
Regression analysis ......................................................................................................................................... 7
Two ways to interpret Y’ ................................................................................................................................ 7
Interpretation regression coefficient b^1 ....................................................................................................... 7
Standardized regression coefficient () ......................................................................................................... 7
Interpretation unstandardized regression coefficient b^1: ........................................................................... 7
Interpretation standardized regression coefficient ^1:................................................................................ 7
Use b ............................................................................................................................................................... 7
Use .............................................................................................................................................................. 7
Sum of squares ............................................................................................................................................... 8
Lecture 4 – 17/09/2018 ...................................................................................................................................... 8
Multiple regression ........................................................................................................................................ 8
Multiple Regression analysis .......................................................................................................................... 8
What do we need to know? ........................................................................................................................... 8
The Linear Multiple Regression model ........................................................................................................... 8
Partial slopes .................................................................................................................................................. 9
Main questions Multiple Regression analysis ................................................................................................ 9
Lecture 5 – 24/09/2018 ...................................................................................................................................... 9
Proportion explained variance ....................................................................................................................... 9
F-Test for the entire model ............................................................................................................................ 9
3. How well does every predictor explain/predict separately? .................................................................... 10
What happens with the explained variance if I remove a predictor? .......................................................... 10
.......................................................................................................................................................................... 11
4. Which predictor is the most important one? ........................................................................................... 12
Lecture 6 – 1/10/2018 ...................................................................................................................................... 12
Hypothesis Testing versus Estimating .......................................................................................................... 12
Multiple Linear Regression Analysis: Starting Point ..................................................................................... 12
Using Multiple regression for ....................................................................................................................... 13
Uniquely explained variance ........................................................................................................................ 13
Lecture 7 – 08/10/2018 .................................................................................................................................... 14
1
, Model with k predictors: Standard Regression Analysis .............................................................................. 14
Adjusted R-square ........................................................................................................................................ 14
Controlling for confounders ......................................................................................................................... 14
Nested models.............................................................................................................................................. 14
What do we use nested model for? ............................................................................................................. 14
Test statistic F ............................................................................................................................................... 14
Hierarchical Regression analysis................................................................................................................... 15
Lecture 8 – 23/10/2018 .................................................................................................................................... 15
Multiple Regression with Dummy variables ................................................................................................. 15
Dummies ...................................................................................................................................................... 15
Categorical values......................................................................................................................................... 15
R-square ....................................................................................................................................................... 16
Dummy Coding ............................................................................................................................................. 16
Lecture 9 – 30/10/2018 .................................................................................................................................... 16
Interaction .................................................................................................................................................... 16
Conceptual Model with an Interaction Effect .............................................................................................. 16
Interpreting main effects in the presence of interaction effects ................................................................. 17
Simple effects ............................................................................................................................................... 17
Lecture 10 – 6/11/2018 .................................................................................................................................... 17
Moderator versus Mediator and Common Cause ........................................................................................ 18
MR with Interaction between Quantitative Variables ................................................................................. 18
Interpretation of centered scores ................................................................................................................ 18
Interpreting the significance of interactions: “Probing” .............................................................................. 18
Multicollinearity ........................................................................................................................................... 18
Variance Inflation Factor (VIF) ...................................................................................................................... 19
Lecture 11 – 13/11/2018 .................................................................................................................................. 20
Overview of statistical techniques ............................................................................................................... 20
Binary Logistic Regression ............................................................................................................................ 20
Determine Logistic Function in Empirical Data ............................................................................................ 21
From probabilities to Odds ........................................................................................................................... 21
From Odds to Logit ....................................................................................................................................... 22
The corresponding function for the Logit..................................................................................................... 22
Lecture 12 – 20/11/2018 .................................................................................................................................. 22
Significance testing ....................................................................................................................................... 22
Pseudo R-square Measures .......................................................................................................................... 23
Classification tables ...................................................................................................................................... 23
Lecture 13 – 27/11/2018 .................................................................................................................................. 24
Q&A .............................................................................................................................................................. 24
2
, Lecture 1 – 28/08/2018
Exam = Multiple choice questions
+ Bonus tutorial quizzes
▪ Simple random sampling
Every member in the population has an equal chance to be sampled
▪ Stratified sampling
The population is divided into strata (e.g., based on gender, age); within each stratum a
random sample is drawn
▪ Convenience sampling
Sample of people who are readily available (e.g., people who are present in the cafeteria,
family and friends of the researcher, first year psychology students)
Descriptive statistics: summarizing data
- Measures of central tendency
o Mean
o Median: the score that separated the higher half of data from the lower half
o Mode: the score that is observed most frequently
- Measures of dispersion
o Variance
o Standard deviation
Inferential statistics: if we want to make generalization about the population, descriptive statistics of
the sample are not enough. We use inferential statistics to draw conclusions about the population,
based on the information from the sample.
- Null hypothesis significance testing
- Confidence interval estimation
Null hypothesis significance testing
1. We formulate the null and alternative hypothesis
H0: = 6.0
H1: 6.0
2. We make a decision-rule
If the P-value < Alpha, we reject the null hypothesis
3. We obtain the T- and P-value from the output
→ Sig. (2-tailed) = two-tailed P value
4. We either reject of keep the null hypothesis and draw
conclusions
We keep the null hypothesis, because P > .05. We do not
have enough evidence to conclude that the average
exam score in the population does not equal 6.0.
Higher than Alpha or lower than Alpha → Reject
It’s very unlikely that it’s correct
Hence accept H1 as opposed to H0
95% Confidence Interval of the Difference
→ we can say with 95% certainty that lies between … and …
Definition: when we carry out an experiment over and over again, the 95% confidence interval will
contain the real value of the parameter of interest (e.g., ) in 95% of the cases.
Interpretation: based on the data, this range of values probably contains .
3