

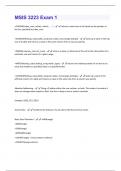
MSIS 3223 Exam 1 =CHOOSE(index_num, value1, value2, . . . ) - returns a value from a list based on the position in the list, specified by index_num =HLOOKUP(lookup_value,table_array,row_index_num,[range lookup]) - looks up a value in the top row of a table and returns a value in the same column from a row you specify. =INDEX(array,row_num,col_num) - returns a value or reference of the cell at the intersection of a particular row and column in a given range. =MATCH(lookup_value,lookup_array,match_type) - returns the relative position of an item in an array that matches a specified value in a specified order. =VLOOKUP(lookup_value,table_array,col_index_num,[range_lookup]) - looks up a value in the leftmost column of a table and returns a value in the same row from a column you specify Absolute Addressing - Using a $ before either the row, column, or both. This makes it to where it does not change when copied or filed. Use this to keep a row or column constant. Example: $A$2, $C5, D$10 Area Charts - combines the features of a pie chart with those of line charts. Basic Excel Functions - =MIN(range) =MAX(range) =SUM(range) =AVERAGE(range) =COUNT(range) - (must contain numbers) =COUNTIF(range,criteria) Bubble Charts - type of scatter chart in which the size of the data marker corresponds to the value of a third variable; consequently, it is a way to plot three variables in two dimensions. Categorical (nominal) data - sorted into categories according to specified characteristics. coefficient of variation (CV) - provides a relative measure of dispersion in data relative to the mean Column and Bar Charts - Excel distinguishes between vertical and horizontal bar charts, calling the former column charts and the latter bar charts. Column and bar charts are useful for comparing categorical or ordinal data, for illustrating differences between sets of values, and for showing proportions or percentages of a whole. Combination Charts - Excel 2016 for Windows provides a Combo Chartoption for constructing such a combination chart; in Excel 2016 for Mac, it must be done manually. We can also plot a second data series on a secondary axis; this is particularly useful when the scales differ greatly. Common Mathematical Operators - Addition + Subtraction - Multiplication * Division / Exponential - ^ Continuous metrics - are based on a continuous scale of measurement. Cross -Tabulations - abular method that displays the number of observations in a data set for different subcategories of two categorical variables.
Examen
MSIS 3223 Exam 1 (Questions & Answers) Rated 100% Correct!!
Puntuación
Vendido
-
Páginas
11
Grado
A+
Subido en
18-07-2024
Escrito en
2023/2024
=CHOOSE(index_num, value1, value2, . . . ) - returns a value from a list based on the position in the list, specified by index_num =HLOOKUP(lookup_value,table_array,row_index_num,[range lookup]) - looks up a value in the top row of a table and returns a value in the same column from a row you specify. =INDEX(array,row_num,col_num) - returns a value or reference of the cell at the intersection of a particular row and column in a given range. =MATCH(lookup_value,lookup_array,match_type) - returns the relative position of an item in an array that matches a specified value in a specified order. =VLOOKUP(lookup_value,table_array,col_index_num,[range_lookup]) - looks up a value in the leftmost column of a table and returns a value in the same row from a column you specify Absolute Addressing - Using a $ before either the row, column, or both. This makes it to where it does not change when copied or filed. Use this to keep a row or column constant. Example: $A$2, $C5, D$10 Area Charts - combines the features of a pie chart with those of line charts. Basic Excel Functions - =MIN(range) =MAX(range) =SUM(range) =AVERAGE(range) =COUNT(range) - (must contain numbers) =COUNTIF(range,criteria)Bubble Charts - type of scatter chart in which the size of the data marker corresponds to the value of a third variable; consequently, it is a way to plot three variables in two dimensions. Categorical (nominal) data - sorted into categories according to specified characteristics. coefficient of variation (CV) - provides a relative measure of dispersion in data relative to the mean Column and Bar Charts - Excel distinguishes between vertical and horizontal bar charts, calling the former column charts and the latter bar charts. Column and bar charts are useful for comparing categorical or ordinal data, for illustrating differences between sets of values, and for showing proportions or percentages of a whole. Combination Charts - Excel 2016 for Windows provides a Combo Chartoption for constructing such a combination chart; in Excel 2016 for Mac, it must be done manually. We can also plot a second data series on a secondary axis; this is particularly useful when the scales differ greatly. Common Mathematical Operators - Addition + Subtraction - Multiplication * Division / Exponential - ^ Continuous metrics - are based on a continuous scale of measurement. Cross-Tabulations - abular method that displays the number of observations in a data set for different subcategories of two categorical variables.Dashboards - visual representation of a set of key business measures. It is derived from the analogy of an automobile's control panel, which displays speed, gasoline level, temperature, and so on. Data - numbers or textual data that are collected through some type of measurement process Data set - a collection of data
Mostrar más
Leer menos
Institución
MSIS 3223
Grado
MSIS 3223
Vista previa del contenido
Escuela, estudio y materia
- Institución
- MSIS 3223
- Grado
- MSIS 3223
Información del documento
- Subido en
- 18 de julio de 2024
- Número de páginas
- 11
- Escrito en
- 2023/2024
- Tipo
- Examen
- Contiene
- Preguntas y respuestas
Temas
-
msis 3223
$8.49
Accede al documento completo:
¿Documento equivocado? Cámbialo gratis
Dentro de los 14 días posteriores a la compra y antes de descargarlo, puedes elegir otro documento. Puedes gastar el importe de nuevo.
Escrito por estudiantes que aprobaron
Inmediatamente disponible después del pago
Leer en línea o como PDF

Documento también disponible en un lote
Package deal
MSIS Bundled with complete solutions;Updated 2024,2025
15
2024
$ 15.99
Más información
