Consumer Report®: Chapter 1
Emotional “Aspirin”
(a) Good science requires that all tests be performed in an objective and unbiased manner. The use of random cod
(“blind testing”) reduces the possibility of unconscious bias.
(b) In most experiments it is impossible to perfectly control all possible environmental influences that could conceiva
affect test results. Randomizing the test order of replicate samples reduces the chance that any one treatment w
be substantially more affected by external influences than any other treatment.
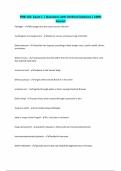
(c) Brand A: 231.2, 232.9, 261.1; Brand B: 224.6, 238.9, 263.7; Brand C: 207.8, 213.4, 227.1; Brand D: 192.8, 219.2, 25
This question requires generalization from the sample tested for a given brand (three lots) to the entire outp
of that brand. How one defines “meeting their label claim” is important. Certainly the brand average needs to
above the claimed value. In addition, it would seem necessary that few, if any of the lots fall below the claim. T
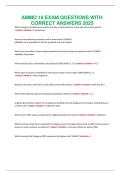
following graph displays the observed amount of SAM-E for the various brands.
Brands A and B clearly appear to meet their label claim as all samples are well above the target of 200 mg. T
brand C average is the closest of the four to the target, but the three observations are the most consistent
any brand, suggesting that it too meets its label claim. Brand D is the most variable of the brands and has o
observation below 200 mg. Even though the sample mean is above 200, the lack of consistency suggests so
chance that a larger sample could average below 200 or that a high proportion of lots might be below 200.
(d) Step 1: Identify the problem to be solved. Consumer Reports® would like to determine if the amount of SAM
contained in several representative brands meets the label claims. Therefore, the response will be the amount
SAM-E (mg) in the pills.
Step 2: Determine the explanatory variables that affect the response variable. Some explanatory variables that aff
the amount of SAM-E measured: Brand, lot from which pills are obtained, and testing mechanism.
Step 3: Determine the number of experimental units. In this experiment, we will measure the amount of SAM-E
12 orders (4 brands) of mood-changing pills.
Step 4: Determine the level of the explanatory variables: We list the explanatory variables and their levels.
• Brand – We wish to determine the difference (if any) in the amount SAM-E as follows:
Brand A: 3 orders
Brand B: 3 orders
Brand C: 3 orders
Brand D: 3 orders
CR-1
Copyright © 2017 Pearson Education, Inc.
, Chapter 1
• Lot from which pills are obtained – Variability in the amount of SAM-E could possibly occur depending on the
lot from which the pills are drawn. To account for this, we randomly select the samples from different lots.
• Testing mechanism – The measurement of SAM-E obtained could vary depending on the accuracy of the testing
mechanism. We can control this somewhat by using the same testing approach for each order of pills. We also
randomize the order in which the pills are tested. We also assign random codes to the various brands so that the
laboratory will not know the manufacturer it is testing, which helps to avoid bias.
Step 5: Conduct the experiment. (a) We determine the order in which the pills will be tested. (b) We determine the
amount of SAM-E for each order of pills.
Step 6: Test the claim. We analyze the data to determine whether the manufacturers are meeting their label claims.
CR-2
Copyright © 2017 Pearson Education, Inc.
, Consumer Report®: Chapter 3
Basement Waterproofing Coatings
a xi 546.2
(a) xA = = ≈ 91.03 g
n 6
90.9 + 91.2 182.1
MA = = = 91.05 g;
2 2
There are 2 modes: 90.8 g and 91.2 g (each value occurs twice).
(b) a xi = 546.2; a x 2i = 49,722.66; n = 6;
1 a xi 2 2
a xi -
2
n
sA =
S n -1
1546.22 2
49,722.66 -
6
=
S 6-1
≈ 0.23 g
a xi 522.3
(c) xB = = = 87.05 g
n 6
87.0 + 87.1 174.1
MB = = = 87.05 g
2 2
There are 2 modes: 87.0 g and 87.2 g (each value occurs twice).
(d) a xi = 522.2; a x 2i = 45,466.33; n = 6;
1 a xi 2 2
a i
2
x -
n
sB =
S n -1
1522.32 2
45,466.33 -
6
=
S 6-1
≈ 0.15 g
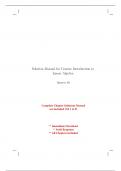
(e) A B
86 8
87 0 0 1 2 2
88
89
9 8 8 90
3 2 2 91
Yes, there appears to be a difference in these two products’ abilities to mitigate water seepage. All 6 of the measurem
for product B are less than the measurements for product A. Although it is not clear whether there is any prac
difference in these two products’ abilities to mitigate water seepage, product B appears to do a better job.
CR-3
Copyright © 2017 Pearson Education, Inc.
, Consumer Report®: Chapter 4
Fit to Drink
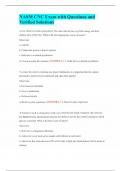
(a)
(b) No, the relation appears to be nonlinear.
(c) r = 0.868. This measure is not very useful since the relation between No. Gallons Processed and % Lead Remov
is nonlinear. R2 = 75.3%. This means that 75.3% of the variation in the percentage of lead removed can
explained by the least-squares regression model.
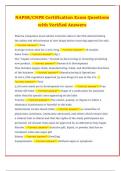
(d) Using Minitab, the linear regression model is: yn = 0.04501x + 84.124, where x = No. Gallons Processed a
y = % Lead Removed.
Notice the bowed pattern in the residual plot. This suggests that the linear model does not adequately describe t
relation between No. Gallons Processed and % Lead Removed.
CR-4
Copyright © 2017 Pearson Education, Inc.
Emotional “Aspirin”
(a) Good science requires that all tests be performed in an objective and unbiased manner. The use of random cod
(“blind testing”) reduces the possibility of unconscious bias.
(b) In most experiments it is impossible to perfectly control all possible environmental influences that could conceiva
affect test results. Randomizing the test order of replicate samples reduces the chance that any one treatment w
be substantially more affected by external influences than any other treatment.
(c) Brand A: 231.2, 232.9, 261.1; Brand B: 224.6, 238.9, 263.7; Brand C: 207.8, 213.4, 227.1; Brand D: 192.8, 219.2, 25
This question requires generalization from the sample tested for a given brand (three lots) to the entire outp
of that brand. How one defines “meeting their label claim” is important. Certainly the brand average needs to
above the claimed value. In addition, it would seem necessary that few, if any of the lots fall below the claim. T
following graph displays the observed amount of SAM-E for the various brands.
Brands A and B clearly appear to meet their label claim as all samples are well above the target of 200 mg. T
brand C average is the closest of the four to the target, but the three observations are the most consistent
any brand, suggesting that it too meets its label claim. Brand D is the most variable of the brands and has o
observation below 200 mg. Even though the sample mean is above 200, the lack of consistency suggests so
chance that a larger sample could average below 200 or that a high proportion of lots might be below 200.
(d) Step 1: Identify the problem to be solved. Consumer Reports® would like to determine if the amount of SAM
contained in several representative brands meets the label claims. Therefore, the response will be the amount
SAM-E (mg) in the pills.
Step 2: Determine the explanatory variables that affect the response variable. Some explanatory variables that aff
the amount of SAM-E measured: Brand, lot from which pills are obtained, and testing mechanism.
Step 3: Determine the number of experimental units. In this experiment, we will measure the amount of SAM-E
12 orders (4 brands) of mood-changing pills.
Step 4: Determine the level of the explanatory variables: We list the explanatory variables and their levels.
• Brand – We wish to determine the difference (if any) in the amount SAM-E as follows:
Brand A: 3 orders
Brand B: 3 orders
Brand C: 3 orders
Brand D: 3 orders
CR-1
Copyright © 2017 Pearson Education, Inc.
, Chapter 1
• Lot from which pills are obtained – Variability in the amount of SAM-E could possibly occur depending on the
lot from which the pills are drawn. To account for this, we randomly select the samples from different lots.
• Testing mechanism – The measurement of SAM-E obtained could vary depending on the accuracy of the testing
mechanism. We can control this somewhat by using the same testing approach for each order of pills. We also
randomize the order in which the pills are tested. We also assign random codes to the various brands so that the
laboratory will not know the manufacturer it is testing, which helps to avoid bias.
Step 5: Conduct the experiment. (a) We determine the order in which the pills will be tested. (b) We determine the
amount of SAM-E for each order of pills.
Step 6: Test the claim. We analyze the data to determine whether the manufacturers are meeting their label claims.
CR-2
Copyright © 2017 Pearson Education, Inc.
, Consumer Report®: Chapter 3
Basement Waterproofing Coatings
a xi 546.2
(a) xA = = ≈ 91.03 g
n 6
90.9 + 91.2 182.1
MA = = = 91.05 g;
2 2
There are 2 modes: 90.8 g and 91.2 g (each value occurs twice).
(b) a xi = 546.2; a x 2i = 49,722.66; n = 6;
1 a xi 2 2
a xi -
2
n
sA =
S n -1
1546.22 2
49,722.66 -
6
=
S 6-1
≈ 0.23 g
a xi 522.3
(c) xB = = = 87.05 g
n 6
87.0 + 87.1 174.1
MB = = = 87.05 g
2 2
There are 2 modes: 87.0 g and 87.2 g (each value occurs twice).
(d) a xi = 522.2; a x 2i = 45,466.33; n = 6;
1 a xi 2 2
a i
2
x -
n
sB =
S n -1
1522.32 2
45,466.33 -
6
=
S 6-1
≈ 0.15 g
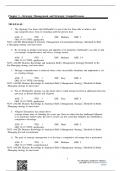
(e) A B
86 8
87 0 0 1 2 2
88
89
9 8 8 90
3 2 2 91
Yes, there appears to be a difference in these two products’ abilities to mitigate water seepage. All 6 of the measurem
for product B are less than the measurements for product A. Although it is not clear whether there is any prac
difference in these two products’ abilities to mitigate water seepage, product B appears to do a better job.
CR-3
Copyright © 2017 Pearson Education, Inc.
, Consumer Report®: Chapter 4
Fit to Drink
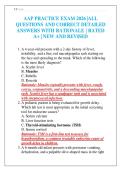
(a)
(b) No, the relation appears to be nonlinear.
(c) r = 0.868. This measure is not very useful since the relation between No. Gallons Processed and % Lead Remov
is nonlinear. R2 = 75.3%. This means that 75.3% of the variation in the percentage of lead removed can
explained by the least-squares regression model.
(d) Using Minitab, the linear regression model is: yn = 0.04501x + 84.124, where x = No. Gallons Processed a
y = % Lead Removed.
Notice the bowed pattern in the residual plot. This suggests that the linear model does not adequately describe t
relation between No. Gallons Processed and % Lead Removed.
CR-4
Copyright © 2017 Pearson Education, Inc.