Chapter 1: Introduction to Statistics
Chapter Outline
1.1 Statistics, Science, and Observation
Definitions of Statistics
1.2 Populations and Samples
What are They?
Variables and Data
Parameters and Statistics
Descriptive and Inferential Statistical Methods
Statistics in the Context of Research
1.3 Data Structures, Research Methods, and Statistics
Individual Variables
Relationships between Variables
The Experimental Method
Nonexperimental Methods: Nonequivalent Groups and Pre-Post Studies
Data Structures and Statistical Methods
1.4 Variables and Measurement
Constructs and Operational Definitions
Discrete and Continuous Variables
, Scales of Measurement
The Nominal Scale
The Ordinal Scale
The Interval and Ratio Scales
Statistics and Scales of Measurement
1.5 Statistical Notation
Summation Notation
Learning Objectives and Chapter Summary
1. Students should be familiar with the terminology and special notation of statistical
analysis. The terminology consists of:
Statistical Terms Measurement Terms Research Terms
population operational definition correlational method
sample nominal experimental method
,parameter ordinal independent variable
statistic interval dependent variable
descriptive statistics ratio nonexperimental method
inferential statistics discrete variable quasi-independent variable
sampling error continuous variable
real limits
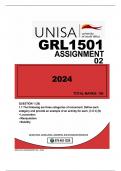
Figure 1.1 is useful for introducing the concepts of population and sample, and the related
concepts of parameter and statistic. The same figure also helps differentiate descriptive
statistics that focus on the sample data and inferential statistics that are used to generalize
from samples to populations.
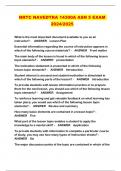
2. Students should learn how statistical techniques fit into the general process of science.
Although the concept of sampling error is not critical at this time in the course, it is a useful
way to introduce and justify the need for inferential statistics. Figure 1.2 is a simple
demonstration of the concept that sample statistics are representative but not identical to
the corresponding population parameters, and that two different samples will tend to have
different statistics. The idea that differences can occur just by chance is the important
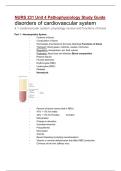
concept. After the concept of sampling error is established, Figure 1.3 shows the overall
research process and identifies where descriptive statistics are used and where inferential
statistics are used.
Statistical techniques are used near the end of the research process, after the researcher has
obtained research results and needs to organize, summarize and interpret the data. Chapter
1 includes discussion of two aspects of research that precede statistics: (1) the process of
measurement, and (2) the idea that measurements take place in the context of a research
study. The discussion includes the different scales of measurement and the information
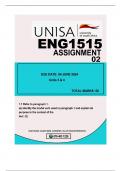
they provide, as well as an introduction to continuous and discrete variables. Research
studies are described in terms of the kinds of data they produce: correlational studies that
produce data suitable for computing correlations (see Figure 1.4), and experimental studies
that produce groups of scores to be compared, usually looking for mean differences (see
, Figure 1.6). Other types of research (non-experimental) that also involve comparing groups
of scores are also discussed (see Figure 1.7).
3. Students should learn the notation, particularly the summation notation, that will be used
throughout the rest of the book.
There are three key concepts important to using summation notation:
1. Summation is a mathematical operation, just like addition or multiplication, and the
different mathematical operations must be performed in the correct order (see Order of
Mathematical Operations, page 25).
2. In statistics, mathematical operations usually apply to a set of scores that can be
presented as a column of numbers.
3. Each operation, except for summation, creates a new column of numbers. Summation,
calculates the sum for the column.
Other Lecture Suggestions
1. Early in the first class I acknowledge that
a. Most students are not there by choice. (No one picked Statistics as an elective because it
looked like a fun class.)
b. Many students have some anxiety about the course.
However, I also try to reassure them that the class will probably be easier and more enjoyable (less
painful) than they would predict, provided they follow a few simple rules:
a. Keep Up. In statistics, each bit of new material builds on the previous material. As long
as you have mastered the old material, then the new stuff is just one small step forward.
On the other hand, if you do not know the old material, then the new stuff is totally
incomprehensible. (For example, try reading Chapter 10 on the first day of class. It will
make no sense at all. However, by the time we get to Chapter 10, you will have enough
background to understand it.) Keeping up means coming to class, asking questions, and
doing homework on a regular basis. If you are getting lost, then get help immediately.
Chapter Outline
1.1 Statistics, Science, and Observation
Definitions of Statistics
1.2 Populations and Samples
What are They?
Variables and Data
Parameters and Statistics
Descriptive and Inferential Statistical Methods
Statistics in the Context of Research
1.3 Data Structures, Research Methods, and Statistics
Individual Variables
Relationships between Variables
The Experimental Method
Nonexperimental Methods: Nonequivalent Groups and Pre-Post Studies
Data Structures and Statistical Methods
1.4 Variables and Measurement
Constructs and Operational Definitions
Discrete and Continuous Variables
, Scales of Measurement
The Nominal Scale
The Ordinal Scale
The Interval and Ratio Scales
Statistics and Scales of Measurement
1.5 Statistical Notation
Summation Notation
Learning Objectives and Chapter Summary
1. Students should be familiar with the terminology and special notation of statistical
analysis. The terminology consists of:
Statistical Terms Measurement Terms Research Terms
population operational definition correlational method
sample nominal experimental method
,parameter ordinal independent variable
statistic interval dependent variable
descriptive statistics ratio nonexperimental method
inferential statistics discrete variable quasi-independent variable
sampling error continuous variable
real limits
Figure 1.1 is useful for introducing the concepts of population and sample, and the related
concepts of parameter and statistic. The same figure also helps differentiate descriptive
statistics that focus on the sample data and inferential statistics that are used to generalize
from samples to populations.
2. Students should learn how statistical techniques fit into the general process of science.
Although the concept of sampling error is not critical at this time in the course, it is a useful
way to introduce and justify the need for inferential statistics. Figure 1.2 is a simple
demonstration of the concept that sample statistics are representative but not identical to
the corresponding population parameters, and that two different samples will tend to have
different statistics. The idea that differences can occur just by chance is the important
concept. After the concept of sampling error is established, Figure 1.3 shows the overall
research process and identifies where descriptive statistics are used and where inferential
statistics are used.
Statistical techniques are used near the end of the research process, after the researcher has
obtained research results and needs to organize, summarize and interpret the data. Chapter
1 includes discussion of two aspects of research that precede statistics: (1) the process of
measurement, and (2) the idea that measurements take place in the context of a research
study. The discussion includes the different scales of measurement and the information
they provide, as well as an introduction to continuous and discrete variables. Research
studies are described in terms of the kinds of data they produce: correlational studies that
produce data suitable for computing correlations (see Figure 1.4), and experimental studies
that produce groups of scores to be compared, usually looking for mean differences (see
, Figure 1.6). Other types of research (non-experimental) that also involve comparing groups
of scores are also discussed (see Figure 1.7).
3. Students should learn the notation, particularly the summation notation, that will be used
throughout the rest of the book.
There are three key concepts important to using summation notation:
1. Summation is a mathematical operation, just like addition or multiplication, and the
different mathematical operations must be performed in the correct order (see Order of
Mathematical Operations, page 25).
2. In statistics, mathematical operations usually apply to a set of scores that can be
presented as a column of numbers.
3. Each operation, except for summation, creates a new column of numbers. Summation,
calculates the sum for the column.
Other Lecture Suggestions
1. Early in the first class I acknowledge that
a. Most students are not there by choice. (No one picked Statistics as an elective because it
looked like a fun class.)
b. Many students have some anxiety about the course.
However, I also try to reassure them that the class will probably be easier and more enjoyable (less
painful) than they would predict, provided they follow a few simple rules:
a. Keep Up. In statistics, each bit of new material builds on the previous material. As long
as you have mastered the old material, then the new stuff is just one small step forward.
On the other hand, if you do not know the old material, then the new stuff is totally
incomprehensible. (For example, try reading Chapter 10 on the first day of class. It will
make no sense at all. However, by the time we get to Chapter 10, you will have enough
background to understand it.) Keeping up means coming to class, asking questions, and
doing homework on a regular basis. If you are getting lost, then get help immediately.