INTRODUCTION TO STATISTICS – Lecture 0 19/11/2018
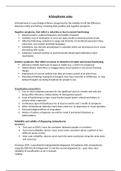
Types of variables
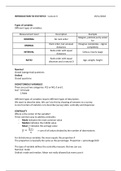
Different types of variables:
Measurement level Description Example
Religion, political party voted
NOMINAL No rank order
for
Rank order, but unequal Disagree completely – Agree
ORDINAL
distances completely
Rank order with equal
INTERVAL Celsius, hourly wage
distances
Rank order with equal
RATIO Age, weight, height
distances and a natural 0
Nominal
Closed (categorical) questions
Ordinal
Closed questions
DICHOTOMOUS VARIABLES
There are just two categories: YES or NO, 0 and 1
Sex? 0.Female
1.Male
Different types of variables require different types of description.
We want to describe data. We can’t do this by showing all answers to a survey.
A core function of statistics is to describe (survey) data: centrality and dispersion.
CENTRALITY
Where is the center of the variable?
Three common way to address centrality:
- Mode indicates the most common value
- Median indicates the middle value
Mean 𝑦̅ indicates the average value
∑ 𝑦𝑖
𝑦̅ = -> sum of all values divided by the number of observations
𝑛
For dichotomous variables the mean equals the proportion 𝜋̂
The proportion is basically the same as the percentage. Proportion = percentage/100
The type of variable defines the centrality measure that we can use.
Nominal: mode
Ordinal: mode and median. Mean not really allowed but every uses it
,Interval/ratio: mode, median, mean
Dichotomous: mean
DISPERSION
If we know the center of data, we know very little about the distribution of data. Data has a
certain level of dispersion. And there are different measures for dispersion:
- Frequencies: how often do we see each answer?
- Range: what’s the minimum and maximum value?
- Standard deviation s
- Variance s2
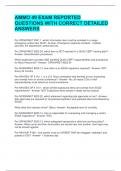
Standard deviation s
The sum of all squared distances to the mean.
If all observations are clustered around the mean, the sum of distances will be small.
If observations are widely dispersed around the mean, the sum of distances will be larger.
The standard deviation is a summary measure of the average distance to the mean.
If there is more dispersion, the standard deviation sy will be higher.
Comparing distributions
If we want to compare different positions in distributions we can use Z-SCORES
Z-score is the amount of standard deviations to the mean.
It is independent of the dispersion of the distribution. It expresses how many standard
deviations we are from the mean.
Z-scores take into account that different distributions might have a different mean and a
different level of dispersion.
A z-score is a standardized measure of the distance from an observation to the mean,
independent of the dispersion of the distribution.
It is useful for inferential statistics.
It all depends on the reference group: importance of context (“relatively”)
, INTRODUCTION TO STATISTICS – Lecture 1 Week 1 – 07/01/2019
On probability, z-scores and distributions
Distribution of data
Data can be distributed in different ways. We can have a skewed distribution or a bell-
shaped distribution. In a perfect bell-shaped distribution, the distribution is perfectly
symmetrical around the mean 𝑦̅. This means that the right and left tail are symmetrical.
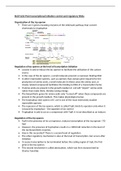
Empirical Rule: we can summarize all observations in bell-shaped distributions:
- 68% of all observations is between 𝑦̅ – s and 𝑦̅ + s
- 95,4% of all observations is between 𝑦̅ – 2s and 𝑦̅ + 2s
- 99,7% of all observations is between 𝑦̅ -3s and 𝑦̅ + 3s
Probabilities and probability distributions
We can think of frequency distributions as probability distributions as well. If we pick one
random inhabitant of De Pijp, for example, what is the probability that he/she is older than
35? We can determine this on the basis of the distribution.
The probability p is the area under the curve.
We can apply this to all normal distributions.
We can also apply this and the Empirical Rule to the standard normal distribution which is a
theoretical distribution used in inferential statistics. Empirical distributions are hardly ever
normally distributed. We use the standard normal distribution for calculations.
Characteristics of the standard normal distribution:
- Bell-shaped
- Perfectly symmetrical
- Mean 𝑦̅ = 0 and standard deviation s = 1
Z-scores and probabilities
Probabilities can be defined as z-scores. In the standard normal distribution z = 1 because 𝑦̅
= 0 and s = 1. Every position in a normal distribution has a z-score with a corresponding
probability that we can check in the Z-table. For normally distributed variables we can
convert z-scores to probabilities (and the other way around).
Types of variables
Different types of variables:
Measurement level Description Example
Religion, political party voted
NOMINAL No rank order
for
Rank order, but unequal Disagree completely – Agree
ORDINAL
distances completely
Rank order with equal
INTERVAL Celsius, hourly wage
distances
Rank order with equal
RATIO Age, weight, height
distances and a natural 0
Nominal
Closed (categorical) questions
Ordinal
Closed questions
DICHOTOMOUS VARIABLES
There are just two categories: YES or NO, 0 and 1
Sex? 0.Female
1.Male
Different types of variables require different types of description.
We want to describe data. We can’t do this by showing all answers to a survey.
A core function of statistics is to describe (survey) data: centrality and dispersion.
CENTRALITY
Where is the center of the variable?
Three common way to address centrality:
- Mode indicates the most common value
- Median indicates the middle value
Mean 𝑦̅ indicates the average value
∑ 𝑦𝑖
𝑦̅ = -> sum of all values divided by the number of observations
𝑛
For dichotomous variables the mean equals the proportion 𝜋̂
The proportion is basically the same as the percentage. Proportion = percentage/100
The type of variable defines the centrality measure that we can use.
Nominal: mode
Ordinal: mode and median. Mean not really allowed but every uses it
,Interval/ratio: mode, median, mean
Dichotomous: mean
DISPERSION
If we know the center of data, we know very little about the distribution of data. Data has a
certain level of dispersion. And there are different measures for dispersion:
- Frequencies: how often do we see each answer?
- Range: what’s the minimum and maximum value?
- Standard deviation s
- Variance s2
Standard deviation s
The sum of all squared distances to the mean.
If all observations are clustered around the mean, the sum of distances will be small.
If observations are widely dispersed around the mean, the sum of distances will be larger.
The standard deviation is a summary measure of the average distance to the mean.
If there is more dispersion, the standard deviation sy will be higher.
Comparing distributions
If we want to compare different positions in distributions we can use Z-SCORES
Z-score is the amount of standard deviations to the mean.
It is independent of the dispersion of the distribution. It expresses how many standard
deviations we are from the mean.
Z-scores take into account that different distributions might have a different mean and a
different level of dispersion.
A z-score is a standardized measure of the distance from an observation to the mean,
independent of the dispersion of the distribution.
It is useful for inferential statistics.
It all depends on the reference group: importance of context (“relatively”)
, INTRODUCTION TO STATISTICS – Lecture 1 Week 1 – 07/01/2019
On probability, z-scores and distributions
Distribution of data
Data can be distributed in different ways. We can have a skewed distribution or a bell-
shaped distribution. In a perfect bell-shaped distribution, the distribution is perfectly
symmetrical around the mean 𝑦̅. This means that the right and left tail are symmetrical.
Empirical Rule: we can summarize all observations in bell-shaped distributions:
- 68% of all observations is between 𝑦̅ – s and 𝑦̅ + s
- 95,4% of all observations is between 𝑦̅ – 2s and 𝑦̅ + 2s
- 99,7% of all observations is between 𝑦̅ -3s and 𝑦̅ + 3s
Probabilities and probability distributions
We can think of frequency distributions as probability distributions as well. If we pick one
random inhabitant of De Pijp, for example, what is the probability that he/she is older than
35? We can determine this on the basis of the distribution.
The probability p is the area under the curve.
We can apply this to all normal distributions.
We can also apply this and the Empirical Rule to the standard normal distribution which is a
theoretical distribution used in inferential statistics. Empirical distributions are hardly ever
normally distributed. We use the standard normal distribution for calculations.
Characteristics of the standard normal distribution:
- Bell-shaped
- Perfectly symmetrical
- Mean 𝑦̅ = 0 and standard deviation s = 1
Z-scores and probabilities
Probabilities can be defined as z-scores. In the standard normal distribution z = 1 because 𝑦̅
= 0 and s = 1. Every position in a normal distribution has a z-score with a corresponding
probability that we can check in the Z-table. For normally distributed variables we can
convert z-scores to probabilities (and the other way around).