Summary #4
Correlational research
- Correlational
= demonstrate the existence of a relationship between 2 or more variables, by simply
measuring 2 different variables for an individual search for patterns/relations
Correlation doesn’t imply causation.
- Experimental
= determine cause and effect, by manipulating one variable and measure the dependent
variable. All other variables are controlled. if dependent variable indeed is variable
causal relationship
- Differential
= demonstrate difference between groups. Two variables 2 groups. Obtain scores for
different groups compare scores
Correlational research scores are presented in a scatter plot.
X/Y axis plot these two variables (horizontal X & vertical Y) taken together draw
data points
Measuring relationships
1. Direction
= positive correlation relationship x and y in same direction = x grows y grows
negative correlation relationship x and y in opposite direction = as x goes up, y goes down
2. form
linear data points cluster around a straight line, increase is consistently predictable.
monotonic the amount of increase/decrease need not be constantly the same number
3. consistency
a correlation coefficient of 1 (or -1) is a strong/the strongest consistency (still not causation)
a correlation coefficient of 0 is no consistency between to variables (no correlation)
non-numerical data
1 score = numerical
1 score = non-numerical
option 1.
use non-numerical variable as groups differential research
Give numerical score per group
Compare using
- independent measures test
- analysis of variance
option 2
calculate correlation by giving the non-numerical variables numbers
e.g.; female= 1 & male= 2
2 scores p.p. you can calculate consistency!
This is a point-biseral correlation
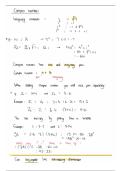
, 2 variables that are numerical
organize data in matrix (rows/columns) fill in frequency of combination in individuals
If both variables have 2 categories use coding
Female 1 succeed 1
Male 2 fail 2
Turn into coded data phi-coefficient
Prediction
Correlations provide basic information that can be used to make predictions.
Even though it cannot be derived from correlational research which of the variables are
causes/effects.
Regression occurs:
Statistical process:
predictor variable: X(1st)
Criterion variable: Y (2nd = explained/predicted)
Purpose
= gain better understanding of the unknown variable by demonstrated that it’s related to an
established/known variable
So; known variable is often predictor
Unknown variable is often criterion
Reliability/validity
Reliability
= consistency/stability of measurement
Validity
= is the variable that is supposed/claimed to be measured, actually measured?
Correlation research is often done to evaluate theories
Interpreting a correlation coefficient (r)
r2 coefficient of determination
= how much of the variability of variable Y is predicted by variable X
Guidelines for interpreting strength of a correlation
coefficient of determination strength
0.10 small
0.30 medium
0.50 large
A correlation found in a relatively large sample group likely to be significant (unlikely to
be caused by another variable)
Correlational research
- Correlational
= demonstrate the existence of a relationship between 2 or more variables, by simply
measuring 2 different variables for an individual search for patterns/relations
Correlation doesn’t imply causation.
- Experimental
= determine cause and effect, by manipulating one variable and measure the dependent
variable. All other variables are controlled. if dependent variable indeed is variable
causal relationship
- Differential
= demonstrate difference between groups. Two variables 2 groups. Obtain scores for
different groups compare scores
Correlational research scores are presented in a scatter plot.
X/Y axis plot these two variables (horizontal X & vertical Y) taken together draw
data points
Measuring relationships
1. Direction
= positive correlation relationship x and y in same direction = x grows y grows
negative correlation relationship x and y in opposite direction = as x goes up, y goes down
2. form
linear data points cluster around a straight line, increase is consistently predictable.
monotonic the amount of increase/decrease need not be constantly the same number
3. consistency
a correlation coefficient of 1 (or -1) is a strong/the strongest consistency (still not causation)
a correlation coefficient of 0 is no consistency between to variables (no correlation)
non-numerical data
1 score = numerical
1 score = non-numerical
option 1.
use non-numerical variable as groups differential research
Give numerical score per group
Compare using
- independent measures test
- analysis of variance
option 2
calculate correlation by giving the non-numerical variables numbers
e.g.; female= 1 & male= 2
2 scores p.p. you can calculate consistency!
This is a point-biseral correlation
, 2 variables that are numerical
organize data in matrix (rows/columns) fill in frequency of combination in individuals
If both variables have 2 categories use coding
Female 1 succeed 1
Male 2 fail 2
Turn into coded data phi-coefficient
Prediction
Correlations provide basic information that can be used to make predictions.
Even though it cannot be derived from correlational research which of the variables are
causes/effects.
Regression occurs:
Statistical process:
predictor variable: X(1st)
Criterion variable: Y (2nd = explained/predicted)
Purpose
= gain better understanding of the unknown variable by demonstrated that it’s related to an
established/known variable
So; known variable is often predictor
Unknown variable is often criterion
Reliability/validity
Reliability
= consistency/stability of measurement
Validity
= is the variable that is supposed/claimed to be measured, actually measured?
Correlation research is often done to evaluate theories
Interpreting a correlation coefficient (r)
r2 coefficient of determination
= how much of the variability of variable Y is predicted by variable X
Guidelines for interpreting strength of a correlation
coefficient of determination strength
0.10 small
0.30 medium
0.50 large
A correlation found in a relatively large sample group likely to be significant (unlikely to
be caused by another variable)