Teacher: Anne Scheel, Irene Klugkist
Notes for Advanced Research Methods and
Statistics for Psychology (ARMS)
Lecture 1: Frequentists/Bayesian framework & Lineair regression analysis
Frequentists & Bayesian statistics
Frequentist framework (mainstream)
Test how well the data fit the H0
P-values, confidence intervals, effect sizes, power analysis
Bayesian framework (increasingly popular)
Probability of the hypothesis given the data, taking prior information into
account
Bayes factor (BF’s), priors, posteriors, credible intervals
Estimation (=schatting)
Frequentist framework;
Empirical research uses collected data to learn from
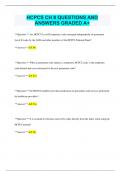
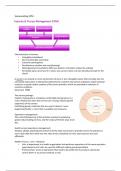
Information in this data is captured in a likelihood function = probability
of the data given a specific mean.
Normally distributed
All relevant informatie for
inference is contained in the
likelihood function
Bayesian framework;
In addition to the data, we may also have a prior information about the
population mean (μ)
Central idea: prior knowledge is updated with information in the data and
together provides the posterior distribution for the population mean
Advantage: Updating knowledge (today posterior is tomorrow’s
prior)
Disadvantage: Results
depend on choice of prior
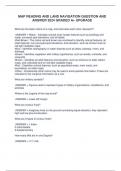
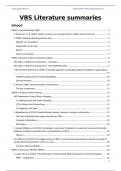
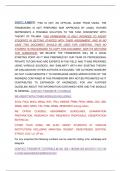
Example of bounding different
priors for estimating IQ;
1. Uninformed (infinite) prior
2. Bounded prior
1
, 3. Curved prior
4. Peaked prior
5. Uncentered&peaked prior
The prior have a
influence on how
the posterior
looks like
Posterior distribution of the parameter of interprets provides all desired
estimates
Posterior mean or mode
Posterior standard deviation (SD)
Posterior 95% credible interval: providing the bounds of the part of the
posterior in which 95% of the posterior mass is
Frequentist statistic: Result and conclusion are influenced by the sampling plan
Probability (=waarschijnlijkheid)
Bayesian framework
Probability that hypothesis 1 is supported by the data (observed data)
PMP = posterior model probability
Probability of the hypothesis after observing the data
Hypothesis being true in bayesian probability depends on 2 criteria:
1. How sensible is it, based on the prior knowledge
2. How well the data fits the new evidence
Hypothesis are being tested against each other
Bayes factor = support for a hypothesis given the other
hypothesis
Not a posterior but you can use the factor to calculate the
posterior
Relative probabilities
Frequentists framework
2
, Probability of observing same or more extreme days given that the null is
true (p- value) (conditions on null hypothesis)
Definition of probability
Frequentists: probability is the relative frequency of events (formal)
Confidence intervals: I I were to repeat this experiment many times, 95%
of the intervals will include the true parameter value
Bayesian; probability is the degree of believe
(intuitive)
Credible interval: there is 95% that the true
value is in the credible interval
Lineair regression
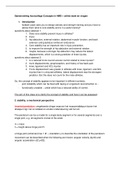
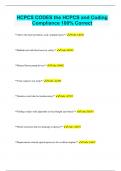
Simple lineair regression (SLR);
Scatterplot for score of 2 variables
Y (hat) = B0 + B1X + e
Y (hat) = model
B0 = intersect (=cross with the y-ax)
B1 = slope (=how steep the line is)
e = residual (=error terms)
Multiple linear regression (MLR);
Scatterplot for scores of more then 2 variables
Y = B0 + B1 + B2 + …. + e (additive lineair model)
Model assumptions linear regression:
Serious violations lead to incorrect results
Sometimes easy solutions (deleting), sometimes it is hard (advanced
solutions presented in this course)
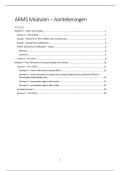
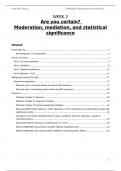
1. MLR assumes
interval/ratio
variables (outcome
and predictors)
MLR can handle
dummy variables
Dummy variabele has
0 and 1 (1=male, 0=female)
Evaluating lineair model
Frequentist statistic;
Estimate parameter of model
NHST if parameters are significantly non-zero
3
Notes for Advanced Research Methods and
Statistics for Psychology (ARMS)
Lecture 1: Frequentists/Bayesian framework & Lineair regression analysis
Frequentists & Bayesian statistics
Frequentist framework (mainstream)
Test how well the data fit the H0
P-values, confidence intervals, effect sizes, power analysis
Bayesian framework (increasingly popular)
Probability of the hypothesis given the data, taking prior information into
account
Bayes factor (BF’s), priors, posteriors, credible intervals
Estimation (=schatting)
Frequentist framework;
Empirical research uses collected data to learn from
Information in this data is captured in a likelihood function = probability
of the data given a specific mean.
Normally distributed
All relevant informatie for
inference is contained in the
likelihood function
Bayesian framework;
In addition to the data, we may also have a prior information about the
population mean (μ)
Central idea: prior knowledge is updated with information in the data and
together provides the posterior distribution for the population mean
Advantage: Updating knowledge (today posterior is tomorrow’s
prior)
Disadvantage: Results
depend on choice of prior
Example of bounding different
priors for estimating IQ;
1. Uninformed (infinite) prior
2. Bounded prior
1
, 3. Curved prior
4. Peaked prior
5. Uncentered&peaked prior
The prior have a
influence on how
the posterior
looks like
Posterior distribution of the parameter of interprets provides all desired
estimates
Posterior mean or mode
Posterior standard deviation (SD)
Posterior 95% credible interval: providing the bounds of the part of the
posterior in which 95% of the posterior mass is
Frequentist statistic: Result and conclusion are influenced by the sampling plan
Probability (=waarschijnlijkheid)
Bayesian framework
Probability that hypothesis 1 is supported by the data (observed data)
PMP = posterior model probability
Probability of the hypothesis after observing the data
Hypothesis being true in bayesian probability depends on 2 criteria:
1. How sensible is it, based on the prior knowledge
2. How well the data fits the new evidence
Hypothesis are being tested against each other
Bayes factor = support for a hypothesis given the other
hypothesis
Not a posterior but you can use the factor to calculate the
posterior
Relative probabilities
Frequentists framework
2
, Probability of observing same or more extreme days given that the null is
true (p- value) (conditions on null hypothesis)
Definition of probability
Frequentists: probability is the relative frequency of events (formal)
Confidence intervals: I I were to repeat this experiment many times, 95%
of the intervals will include the true parameter value
Bayesian; probability is the degree of believe
(intuitive)
Credible interval: there is 95% that the true
value is in the credible interval
Lineair regression
Simple lineair regression (SLR);
Scatterplot for score of 2 variables
Y (hat) = B0 + B1X + e
Y (hat) = model
B0 = intersect (=cross with the y-ax)
B1 = slope (=how steep the line is)
e = residual (=error terms)
Multiple linear regression (MLR);
Scatterplot for scores of more then 2 variables
Y = B0 + B1 + B2 + …. + e (additive lineair model)
Model assumptions linear regression:
Serious violations lead to incorrect results
Sometimes easy solutions (deleting), sometimes it is hard (advanced
solutions presented in this course)
1. MLR assumes
interval/ratio
variables (outcome
and predictors)
MLR can handle
dummy variables
Dummy variabele has
0 and 1 (1=male, 0=female)
Evaluating lineair model
Frequentist statistic;
Estimate parameter of model
NHST if parameters are significantly non-zero
3