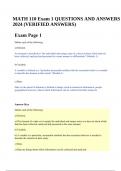
Exam Page 1 Define each of the following: a) Element. An element is described as "the individual and unique entry in a data set about which data has been collected, analyzed and presented in a same manner to differentiate" (Module 1). b) Variable. A variable is defined as a "particular measurable attribute that the researcher believes is needed to describe the element in their study" (Module 1). c) Data. Data (or the plural of datumn) is defined as things (such as numerical information, people, geographical areas,etc.) about which information can be collected and then analyzed. Answer Key Define each of the following: a) Element. a) The element of a data set is simply the individual and unique entry in a data set about which data has been collected, analyzed and presented in the same manner. b) Variable. b) A variable is a particular, measurable attribute that the researcher believes is needed to describe the element in their study. c) Data. c) Data are things about which information can be collected and analyzed. MATH 110 Exam 1 QUESTIONS AND ANSWERS 2024 (VERIFIED ANSWERS) Exam Page 2 Explain the difference between population and sample. "The entire number of items in a large group" would be defined as the population. (Module 1) The sample is then taken from the population by a researcher and is studied.The sample taken from the population is, in fact, the subset of the population. You need the population to get the sample and without the population, there can be no sample. Instructor Comments Very good definitions. Answer Key Exam Page 3 Look at the following data and see if you can identify any outliers: 65 71 55 69 3 77 67 70 246 61 277 3, 246, 277 Instructor Comments Very good. Answer Key Explain the difference between population and sample. Population is the entire number of items in a large group. A sample is representative group from the population. Look at the following data and see if you can identify any outliers: 65 71 55 69 3 77 67 70 246 61 277 Exam Page 4 The following pie chart shows the percentages of total items sold in a month in a certain fast food restaurant. A total of 4900 fast food items were sold during the month. How many were burgers? How many were french fries? 4900(.32)=1568 32% or 1,568 burgers were sold during the month. 4900(.18)=882 18% or 882 french fries were sold during the month. Instructor Comments Very good. Answer Key The outliers are: 3 246 277 The following pie chart shows the percentages of total items sold in a month in a certain fast food restaurant. Exam 2 Exam Page 1 During an hour at a fast food restaurant, the following types of sandwiches are ordered: Turkey Hamburger Cheeseburger Fish Hamburger Turkey Fish Chicken Fish Chicken Turkey Fish Hamburger Fish Cheeseburger Fish Cheeseburger Hamburger Fish Fish Cheeseburger Hamburger Fish Turkey Turkey Chicken Fish Chicken Cheeseburger Fish Turkey Fish Fish Hamburger Fish Fish Turkey Chicken Hamburger Fish Cheeseburger Chicken Chicken Turkey Fish Chicken Hamburger Chicken Fish Chicken a) Make a frequency distribution for this data. Types of Frequency Sandwiches Turkey 8 A total of 4900 fast food items were sold during the month. How many were burgers? How many were french fries? Burgers : 4900(.32) = 1568 French Fries : 4900(.18) = 882
Examen
MATH 110 Exam 1 QUESTIONS AND ANSWERS 2024 (VERIFIED ANSWERS).
Puntuación
Vendido
-
Páginas
34
Grado
A+
Subido en
21-05-2024
Escrito en
2023/2024
MATH 110 Exam 1 QUESTIONS AND ANSWERS 2024 (VERIFIED ANSWERS). Exam Page 1 Define each of the following: a) Element. An element is described as "the individual and unique entry in a data set about which data has been collected, analyzed and presented in a same manner to differentiate" (Module 1). b) Variable. A variable is defined as a "particular measurable attribute that the researcher believes is needed to describe the element in their study" (Module 1). c) Data. Data (or the plural of datumn) is defined as things (such as numerical information, people, geographical areas,etc.) about which information can be collected and then analyzed. Answer Key Define each of the following: a) Element. a) The element of a data set is simply the individual and unique entry in a data set about which data has been collected, analyzed and presented in the same manner. b) Variable. b) A variable is a particular, measurable attribute that the researcher believes is needed to describe the element in their study. c) Data. c) Data are things about which information can be collected and analyzed. MATH 110 Exam 1 QUESTIONS AND ANSWERS 2024 (VERIFIED ANSWERS) Exam Page 2 Explain the difference between population and sample. "The entire number of items in a large group" would be defined as the population. (Module 1) The sample is then taken from the population by a researcher and is studied.The sample taken from the population is, in fact, the subset of the population. You need the population to get the sample and without the population, there can be no sample. Instructor Comments Very good definitions. Answer Key Exam Page 3 Look at the following data and see if you can identify any outliers: 277 3, 246, 277 Instructor Comments Very good. Answer Key Explain the difference between population and sample. Population is the entire number of items in a large group. A sample is representative group from the population. Look at the following data and see if you can identify any outliers: 277 Exam Page 4 The following pie chart shows the percentages of total items sold in a month in a certain fast food restaurant. A total of 4900 fast food items were sold during the month. How many were burgers? How many were french fries? 4900(.32)=1568 32% or 1,568 burgers were sold during the month. 4900(.18)=882 18% or 882 french fries were sold during the month. Instructor Comments Very good. Answer Key The outliers are: 3 246 277 The following pie chart shows the percentages of total items sold in a month in a certain fast food restaurant. Exam 2 Exam Page 1 During an hour at a fast food restaurant, the following types of sandwiches are ordered: Turkey Hamburger Cheeseburger Fish Hamburger Turkey Fish Chicken Fish Chicken Turkey Fish Hamburger Fish Cheeseburger Fish Cheeseburger Hamburger Fish Fish Cheeseburger Hamburger Fish Turkey Turkey Chicken Fish Chicken Cheeseburger Fish Turkey Fish Fish Hamburger Fish Fish Turkey Chicken Hamburger Fish Cheeseburger Chicken Chicken Turkey Fish Chicken Hamburger Chicken Fish Chicken a) Make a frequency distribution for this data. Types of Frequency Sandwiches Turkey 8 A total of 4900 fast food items were sold during the month. How many were burgers? How many were french fries? Burgers : 4900(.32) = 1568 French Fries : 4900(.18) = 882.
Mostrar más
Leer menos
Institución
MATH 110
Grado
MATH 110
Ups! No podemos cargar tu documento ahora. Inténtalo de nuevo o contacta con soporte.
Escuela, estudio y materia
- Institución
- MATH 110
- Grado
- MATH 110
Información del documento
- Subido en
- 21 de mayo de 2024
- Número de páginas
- 34
- Escrito en
- 2023/2024
- Tipo
- Examen
- Contiene
- Preguntas y respuestas
Temas
-
math 110 exam 1 questions and answers 2024
-
math 110 exam 1 questions and answers
-
math 110 questions and answers
-
math 110 exam 1 2024 verified answers
-
math 110 questions and answers 2024 verified
Vista previa del contenido
$13.99
Accede al documento completo:
100% de satisfacción garantizada
Inmediatamente disponible después del pago
Tanto en línea como en PDF
No estas atado a nada
Documento también disponible en un lote
Package deal
MATH 110 MODULE 4 EXAM QUESTIONS AND ANSWERS, MATH 110 Statistics Module 2 Exam Latest 2024 & MATH 110 Exam 1 QUESTIONS AND ANSWERS 2024 (VERIFIED ANSWERS).
3
2024
$ 36.97
Más información