Management Research Methods 2 for Accountancy & Control
Week 1: Conceptual models & ANOVA
Variables we use:
- Outcome variable (OV) / Dependent variable (DV): variable to be explained.
- Predictor variable (PV) / Independent variable (IV); Variable that explains.
The p-value stands for the probability of obtaining a result (or test-statistic value).
If the P-value is <0.05, it means we need to reject H0.
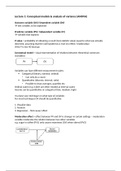
Conceptual models:
Conceptual models help to visualize your research question and to build the hypothesis.
It is a visual representation of relations between theoretical constructs (variables) of
interest.
In research: by “model” we mean a simplified description of reality.
Variables can have different measurement scales:
- Categorical (binary, nominal, ordinal)
- Quantitative (discrete, interval, ratio)
Conceptual models: moderation
Moderating variables (or moderators): These alter the effect that an independent variable
has on a dependent variable. In other words, moderators change the “effect” component of
the cause-and-effect relationship.
For example:
RQ: What is the effect of a teacher’s commitment on student satisfaction, and how is this
relationship moderated by a teacher's communication skills?
H0: A teacher’s communication skills will not influence the relationship between the
commitment of the teacher and student satisfaction.
Ha: Teachers who are more committed will increase the satisfaction level of students,
but only when they have good communication skills.
, “Communication skills” is a moderation variable in this example. It moderates the
relationship between the main PV on the OV.
Conceptual models: mediation
Mediating variables (or mediator): Explains the process through which two variables are
related. A mediator is a way in which an independent variable impacts a dependent variable.
It’s part of the causal pathway of an effect, and it tells you how or why an effect takes place.
For example:
RQ: What underlying mechanism drives the effect of teacher’s commitment on student
satisfaction?
H0: The effect of teacher’s commitments on student satisfaction is not mediated by the
quality of the course material)
Ha: The positive effect of a teacher’s commitment on student satisfaction is mediated by the
quality of the course material.
“Lecture slide quality” is a mediating variable in this example. It mediates the relationship
between two other variables.
ANOVA:
With the ANOVA test, you can investigate with a certain level of (statistical) confidence, what
differences there might be between groups. It compares the variability between groups,
against the variability within groups. (Does it matter in which group you are?)
ANOVA/Analysis of variance:
- Statistically examines how much of the variability in our outcome variable can be
explained by our predictor variable.
- Outcome Variable (OV) = Quantitative
- Predictor Variable (PV) = Categorical with more than 2 groups.
,Assumptions:
- Variance is homogenous across groups (Levene’s test).
- Our subjects can only be in one group (Depedent).
- Group sizes need to be equal.
Example:
RQ: Is there a relation between shopping platform and customer satisfaction?
PV = Shopping platform (Categorical with three levels: 1-Brick-and-mortar store 2-web shop
3- Reseller).
OV = Customer satisfaction (Quantitative: score from 1-50).
SSr -Total variance in the data:
SSm: Model sum of squares:
, SSR: Residual sum of squares:
The total sum of squares:
1992.10 = 1140.68 + 51.42
Now we have this data, we can calculate the proportion of the total variance in our data that
is “explained” by our model. R2 (R squared)
Week 1: Conceptual models & ANOVA
Variables we use:
- Outcome variable (OV) / Dependent variable (DV): variable to be explained.
- Predictor variable (PV) / Independent variable (IV); Variable that explains.
The p-value stands for the probability of obtaining a result (or test-statistic value).
If the P-value is <0.05, it means we need to reject H0.
Conceptual models:
Conceptual models help to visualize your research question and to build the hypothesis.
It is a visual representation of relations between theoretical constructs (variables) of
interest.
In research: by “model” we mean a simplified description of reality.
Variables can have different measurement scales:
- Categorical (binary, nominal, ordinal)
- Quantitative (discrete, interval, ratio)
Conceptual models: moderation
Moderating variables (or moderators): These alter the effect that an independent variable
has on a dependent variable. In other words, moderators change the “effect” component of
the cause-and-effect relationship.
For example:
RQ: What is the effect of a teacher’s commitment on student satisfaction, and how is this
relationship moderated by a teacher's communication skills?
H0: A teacher’s communication skills will not influence the relationship between the
commitment of the teacher and student satisfaction.
Ha: Teachers who are more committed will increase the satisfaction level of students,
but only when they have good communication skills.
, “Communication skills” is a moderation variable in this example. It moderates the
relationship between the main PV on the OV.
Conceptual models: mediation
Mediating variables (or mediator): Explains the process through which two variables are
related. A mediator is a way in which an independent variable impacts a dependent variable.
It’s part of the causal pathway of an effect, and it tells you how or why an effect takes place.
For example:
RQ: What underlying mechanism drives the effect of teacher’s commitment on student
satisfaction?
H0: The effect of teacher’s commitments on student satisfaction is not mediated by the
quality of the course material)
Ha: The positive effect of a teacher’s commitment on student satisfaction is mediated by the
quality of the course material.
“Lecture slide quality” is a mediating variable in this example. It mediates the relationship
between two other variables.
ANOVA:
With the ANOVA test, you can investigate with a certain level of (statistical) confidence, what
differences there might be between groups. It compares the variability between groups,
against the variability within groups. (Does it matter in which group you are?)
ANOVA/Analysis of variance:
- Statistically examines how much of the variability in our outcome variable can be
explained by our predictor variable.
- Outcome Variable (OV) = Quantitative
- Predictor Variable (PV) = Categorical with more than 2 groups.
,Assumptions:
- Variance is homogenous across groups (Levene’s test).
- Our subjects can only be in one group (Depedent).
- Group sizes need to be equal.
Example:
RQ: Is there a relation between shopping platform and customer satisfaction?
PV = Shopping platform (Categorical with three levels: 1-Brick-and-mortar store 2-web shop
3- Reseller).
OV = Customer satisfaction (Quantitative: score from 1-50).
SSr -Total variance in the data:
SSm: Model sum of squares:
, SSR: Residual sum of squares:
The total sum of squares:
1992.10 = 1140.68 + 51.42
Now we have this data, we can calculate the proportion of the total variance in our data that
is “explained” by our model. R2 (R squared)