HIG_2012_LBO_Model_Test exam latest 2024
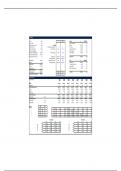
Assumptions Tax Rate 40.0% 1 Base Sources $ '11 EBITDA Dep. % of Sales 1.0% Balance Sheet Cash $0 0.0x Growth Capex / New Rest. $300 Operating Revolver $31,750 1.3x Mait. Capex / Rest. $10 # New Restaurant Growth 6 6 Term Loan $49,500 2.0x Minimum Cash Balance $2,000 AUV % Growth 0.0% 0.0% Contingent Seller Note $12,375 0.5x Interest on Cash Balance 0.5% Rollover Equity $12,375 0.5x Seller Note Low EBITDA Band $30,000 % Gross Margin 70.0% 70.0% Sponsor Equity $37,125 1.5x Seller Note High EBITDA Band $40,000 Financing Fees Amor. Period 7 yrs Rent Expense $75/rest. $75/rest. Total Sources $143,125 5.8x Owners Base Salary $500/own. $500/own. 2011A EBITDA $24,750 Owners Revenue Share 0.5% 0.5% Uses $ '11 EBITDA Multiple 5.5x Operating Expenses $650/rest. $650/rest. Purchase Price $136,125 5.5x Purchase Price $136,125 Min Balance Sheet Cash $2,000 0.1x (+) Cash $1,000 Financing Fees $3,000 0.1x (-) Existing Debt $0 Other Transaction Fees $2,000 0.1x Equity Purchase Price $137,125 (-) Existing Equity ($80,000) S&U TRUE Total Uses $143,125 5.8x Purchase Price to be Allocated $57,125 BS TRUE Returns Schedule ($ in thousands) 2012E 2013E 2014E 2015E 2016E 2017E 2018E 2019E EBITDA $26,655 $28,560 $30,465 $32,370 $34,275 $36,180 $38,085 $39,990 Exit Multiple 7.0x 7.0x 7.0x 7.0x 7.0x 7.0x 7.0x 7.0x Terminal Enterprise Value $186,585 $199,920 $213,255 $226,590 $239,925 $253,260 $266,595 $279,930 (-) Debt (67,789) (53,188) (49,469) (49,459) (49,448) (49,437) (49,426) (49,414) (+) Cash 2,000 2,000 2,000 2,000 2,000 2,000 2,000 2,000 (-) Seller Note 0 0 (9,425) (10,014) (10,604) (11,193) (11,783) (12,372) Terminal Equity Value $120,796 $148,732 $156,360 $169,117 $181,873 $194,630 $207,387 $220,144 Mgmt Options 10.0% (12,080) (14,873) (15,636) (16,912) (18,187) (19,463) (20,739) (22,014) Terminal Equity Value $108,717 $133,859 $140,724 $152,205 $163,686 $175,167 $186,648 $198,130 Rollover Equity 25.0% 27,179 33,465 35,181 38,051 40,921 43,792 46,662 49,532 Sponsor Equity 75.0% 81,538 100,394 105,543 114,154 122,764 131,375 139,986 148,597 Exit Year IRR COC 3 46.8% 3.2x ($37,125) $0 $0 $117,544 $0 $0 $0 $0 $0 4 41.3% 3.9x ($37,125) $0 $0 $12,001 $130,982 $0 $0 $0 $0 5 38.2% 4.6x ($37,125) $0 $0 $12,001 $16,828 $140,712 $0 $0 $0 6 36.1% 5.3x ($37,125) $0 $0 $12,001 $16,828 $17,947 $150,441 $0 $0 7 34.7% 6.1x ($37,125) $0 $0 $12,001 $16,828 $17,947 $19,066 $160,171 $0 Exit Multiple Exit Multiple 38% 5.0x 6.0x 7.0x 8.0x 457% 5.0x 6.0x 7.0x 8.0x AUV Growth 0.0% 29.7% 34.2% 38.2% 41.7% AUV Growth 0.0% 3.3x 3.9x 4.6x 5.2x 1.0% 37.0% 41.4% 45.3% 48.7% 1.0% 4.2x 5.0x 5.7x 6.5x 2.0% 43.6% 47.9% 51.8% 55.2% 2.0% 5.2x 6.1x 7.0x 7.9x 3.0% 49.7% 54.0% 57.9% 61.4% 3.0% 6.2x 7.2x 8.3x 9.3x 4.0% 55.4% 59.7% 63.5% 67.0% 4.0% 7.3x 8.4x 9.6x 10.8x Income Statement ($ in thousands) 2011A 2012E 2013E 2014E 2015E 2016E 2017E 2018E 2019E Restaurants 100 106 112 118 124 130 136 142 148 # New Restaurant Growth 6 6 6 6 6 6 6 6 AUV $1,500 $1,500 $1,500 $1,500 $1,500 $1,500 $1,500 $1,500 $1,500 % Growth 0.0% 0.0% 0.0% 0.0% 0.0% 0.0% 0.0% 0.0% Revenue $150,000 $159,000 $168,000 $177,000 $186,000 $195,000 $204,000 $213,000 $222,000 COGS 45,000 47,700 50,400 53,100 55,800 58,500 61,200 63,900 66,600 Gross Margin $105,000 $111,300 $117,600 $123,900 $130,200 $136,500 $142,800 $149,100 $155,400 % Margin 70.0% 70.0% 70.0% 70.0% 70.0% 70.0% 70.0% 70.0% 70.0%
Escuela, estudio y materia
- Institución
- LBO Modeling Exa
- Grado
- LBO Modeling Exa
Información del documento
- Subido en
- 3 de marzo de 2024
- Número de páginas
- 3
- Escrito en
- 2023/2024
- Tipo
- Examen
- Contiene
- Preguntas y respuestas
Temas
-
hig2012lbomodeltest
Documento también disponible en un lote