More buyers(high demand) and less seller(low supply) increase in price and volume – buy
assets
Less buyers(low demand) and more seller( high supply) decrease in price and volume – sell
the asset
Bulls- people when the price of asset goes up(buyers)
Bears- people when the price of asset goes down(sellers)
CANDLESTICK CHART
o Representaton of stock price movement chart that comprises of small units called candles.
o It gives more detailed inf. On price movement-OHLC(open price,high,low,close price)
o HELPS TO PREDICT THE DIRECTION OF PRICE MOVEMENT
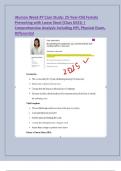
CANDLE
o Represents priceactivity in stock in a particular frame.
Real body-connects the opening and closing price.
Upper shadow-connects high points to close/open
Lower shadow- connects low points to open/close
Bullish- green,bearish-red.
Bullish candle-
buying activity in a stock in a particular time frame.
Close higher than open
Shows more activity from buyers.
Bearish candle-
selling activity in a stock in a particular time frame.
Close lower than open
Shows more activity from sellers.
TYPES OF CANDLES-SINGLE CANDLESTICK PATTERN
SINGLE CANDLESTICK PATTERNS
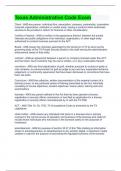
Marubozu
-candlestick with no upper and lower shadow.
-real body and appear anywhere in the chart irrespective of the prior trend.
Bullish marubozu - open= low and high =close
Indicate stock is now is bullish
, Buy at close,SL at low
Bearish marubozu - open= high and low =close
Indicate stock is now bearish
sell at close,SL at high
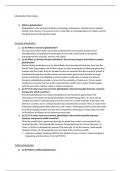
SPINING TOP
indicates indecision and consolidation.indicator for trend
reversal
candles have small body
upper and lower shadow are almost equal.
Body colour does not matter as it is small
Downtrend
uptrend
DOJI
o no having real body at all ,onlu miniscule body
o it means open and close price are equal.
o Bulls and bears hav similar strength at the moment.
o Indicates indecision in the market.indicate trend reversal as well
o various doji:
Don’t take new trade.
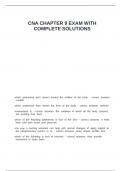
PAPER UMBRELLA
o single candlestick pattern which helps traders in setting up directional
trades.
o It changes based on where it appears on the chart. It has:
Small upper body
Long lower shadow.
Lower shadow should at least twice the length
bodyColour does not matter
Hammer - it appers at the bottom end of a downwaed rally.
Indicates trend reversal to bullish.Buy at close ,SL at low
Hanging man - appears at the top end of a downard rally.Indicates
trend reversal to bearish. Sell at close ,SL at high.
SHOOTING STAR
o helps traders in setting up directional trades.
o Bearish pattern
o Sell at close.SL at high
assets
Less buyers(low demand) and more seller( high supply) decrease in price and volume – sell
the asset
Bulls- people when the price of asset goes up(buyers)
Bears- people when the price of asset goes down(sellers)
CANDLESTICK CHART
o Representaton of stock price movement chart that comprises of small units called candles.
o It gives more detailed inf. On price movement-OHLC(open price,high,low,close price)
o HELPS TO PREDICT THE DIRECTION OF PRICE MOVEMENT
CANDLE
o Represents priceactivity in stock in a particular frame.
Real body-connects the opening and closing price.
Upper shadow-connects high points to close/open
Lower shadow- connects low points to open/close
Bullish- green,bearish-red.
Bullish candle-
buying activity in a stock in a particular time frame.
Close higher than open
Shows more activity from buyers.
Bearish candle-
selling activity in a stock in a particular time frame.
Close lower than open
Shows more activity from sellers.
TYPES OF CANDLES-SINGLE CANDLESTICK PATTERN
SINGLE CANDLESTICK PATTERNS
Marubozu
-candlestick with no upper and lower shadow.
-real body and appear anywhere in the chart irrespective of the prior trend.
Bullish marubozu - open= low and high =close
Indicate stock is now is bullish
, Buy at close,SL at low
Bearish marubozu - open= high and low =close
Indicate stock is now bearish
sell at close,SL at high
SPINING TOP
indicates indecision and consolidation.indicator for trend
reversal
candles have small body
upper and lower shadow are almost equal.
Body colour does not matter as it is small
Downtrend
uptrend
DOJI
o no having real body at all ,onlu miniscule body
o it means open and close price are equal.
o Bulls and bears hav similar strength at the moment.
o Indicates indecision in the market.indicate trend reversal as well
o various doji:
Don’t take new trade.
PAPER UMBRELLA
o single candlestick pattern which helps traders in setting up directional
trades.
o It changes based on where it appears on the chart. It has:
Small upper body
Long lower shadow.
Lower shadow should at least twice the length
bodyColour does not matter
Hammer - it appers at the bottom end of a downwaed rally.
Indicates trend reversal to bullish.Buy at close ,SL at low
Hanging man - appears at the top end of a downard rally.Indicates
trend reversal to bearish. Sell at close ,SL at high.
SHOOTING STAR
o helps traders in setting up directional trades.
o Bearish pattern
o Sell at close.SL at high