1
MANAGEMENT SCIENCE HOMEWORK
SESSION 1 INTRODUCTION & EXCEL PRACTICUM ................................................................................................... 2
REVIEW QUESTIONS ........................................................................................................................................... 2
HOMEWORK ....................................................................................................................................................... 3
PROBLEMS .......................................................................................................................................................... 6
EXCEL TUTORIALS ................................................................................................................................................ 8
SLIDES ................................................................................................................................................................. 9
PREPARATION QUIZ 1 ........................................................................................................................................ 15
BOOK SLIDES ..................................................................................................................................................... 16
SESSION 2 CLASSIFICATION & FORECASTING ........................................................................................................ 20
REVIEW QUESTIONS ......................................................................................................................................... 20
HOMEWORK ..................................................................................................................................................... 23
PROBLEMS ........................................................................................................................................................ 25
SLIDES ............................................................................................................................................................... 29
PREPARATION QUIZ 2.1 ..................................................................................................................................... 42
PREPARATION QUIZ 2.2 ..................................................................................................................................... 43
BOOK SLIDES ..................................................................................................................................................... 44
SESSION 3 LINEAR PROGRAMMING ...................................................................................................................... 51
REVIEW QUESTIONS ......................................................................................................................................... 51
HOMEWORK ..................................................................................................................................................... 53
PROBLEMS ........................................................................................................................................................ 56
SLIDES ............................................................................................................................................................... 59
PREPARATION QUIZ 3 ........................................................................................................................................ 62
BOOK SLIDES ..................................................................................................................................................... 67
SESSION 4 NETWORK OPTIMIZATION & INTEGER PROGRAMMING ..................................................................... 69
REVIEW QUESTIONS ......................................................................................................................................... 69
HOMEWORK ..................................................................................................................................................... 70
PROBLEMS ........................................................................................................................................................ 74
SLIDES ............................................................................................................................................................... 76
PREPARATION QUIZ 4 ........................................................................................................................................ 77
BOOK SLIDES ..................................................................................................................................................... 79
SESSION 5 NONLINEAR PROGRAMMING & DECISION ANALYSIS .......................................................................... 82
REVIEW QUESTIONS ......................................................................................................................................... 82
HOMEWORK ..................................................................................................................................................... 83
PROBLEMS ........................................................................................................................................................ 86
SLIDES ............................................................................................................................................................... 89
PREPARATION QUIZ 5 ........................................................................................................................................ 92
BOOK SLIDES ..................................................................................................................................................... 95
, 2
SESSION 1 INTRODUCTION & EXCEL PRACTICUM
CHAPTER 1 & 2
- What is Management Science?
- What do some basic functions in Excel such as SUM, MIN, AVERAGE, STDEV.S, IF, SUMIF,
SUMPRODUCT do?
- How to filter and sort data in Excel?
- How to visualize data in Excel? How to make bar charts, histograms, boxplots, scatter plots,
line charts?
- How to compute correlation in Excel?
- How to run a regression in Excel?
REVIEW QUESTIONS
1.4.3: What intuitive property of the relationship between sales and advertising is not captured by
linear regression? There are often diminishing returns from advertising that are not captured by
linear regression.
1.4.4: What is the potential serious flaw of using the polynomial equation to predict sales? If a
polynomial equation is used to try to predict what sales will be for advertising budgets, it will
eventually start sloping downward. While we intuitively would expect diminishing returns as
advertising is increased, we wouldn’t expect sales to actually decrease.
1.4.5: What does the square-root effect suggest about the relationship between sales and
advertising? Sales do not increase proportionally with the level of advertising, but rather increase
proportionally with the square root of advertising. The square-root effect is a rule of thumb in
advertising suggesting that sales increase proportionally with the square root of advertising.
2.3.1: What are the four steps of descriptive analytics? Step 1: Gather and organize relevant data.
Step 2: Clean the data. Step 3: Explore the data. Step 4: Communicate performance information using
data visualization.
2.3.2: What has caused the data surge during this era of big data? The data surge has been a result
of sophisticated computer tracking of all of the organization’s internal transactions. The data also can
come flooding in from sources such as web traffic, social networks, sensors of various types, and
captures of audio and video recordings.
2.3.3: What is the difference between a numerical and categorical variable? Numerical variable= A
variable that takes on numerical values. The possible numerical values could be continuous (any
numerical or decimal value) or integer, usually within a given range. Categorical variable= A type of
variable that can take on only a small number of values that represent the few possible categories.
The values could be expressed either numerically (0 or 1) or with text. Categorical variables can be
further differentiated into either nominal variables (order of values have no meaning) or ordinal
variables (natural order in values).
2.3.4: Give three examples of types of errors that are corrected during data cleaning? For example,
missing data, improperly formatted data, and duplicated data.
2.4.4: What does the k-nearest-neighbours algorithm base its predictions upon? It uses the
observed behaviour of customers (for example) (the k nearest neighbours of this customer) to predict
what the prospective customer will do.
, 3
2.4.9: What does it mean to overfit to the data? A model that fits the historical data too precisely is
referred to as overfitting the data because it is overly accounting for the noise. Overfitting the data=
Making a predictive model less accurate when using new data sets by having the model align too
closely to the given data instead of taking into account the inherent idiosyncrasies in the given data
due to randomness.
A model that overfits to the historical data will incorporate and account for too much of the noise,
potentially to the point of missing the main signal, and therefore may make poor predictions with
new data.
2.4.11: What is the difference between specificity and sensitivity? Specificity= The ability to
correctly predict a negative outcome. Sensitivity= The ability to correctly predict a positive outcome.
HOMEWORK
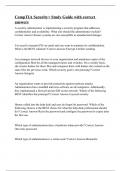
1.9:
A: B:
, 4
C:
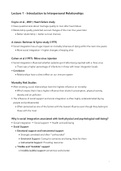
2.17:
2.18:
MANAGEMENT SCIENCE HOMEWORK
SESSION 1 INTRODUCTION & EXCEL PRACTICUM ................................................................................................... 2
REVIEW QUESTIONS ........................................................................................................................................... 2
HOMEWORK ....................................................................................................................................................... 3
PROBLEMS .......................................................................................................................................................... 6
EXCEL TUTORIALS ................................................................................................................................................ 8
SLIDES ................................................................................................................................................................. 9
PREPARATION QUIZ 1 ........................................................................................................................................ 15
BOOK SLIDES ..................................................................................................................................................... 16
SESSION 2 CLASSIFICATION & FORECASTING ........................................................................................................ 20
REVIEW QUESTIONS ......................................................................................................................................... 20
HOMEWORK ..................................................................................................................................................... 23
PROBLEMS ........................................................................................................................................................ 25
SLIDES ............................................................................................................................................................... 29
PREPARATION QUIZ 2.1 ..................................................................................................................................... 42
PREPARATION QUIZ 2.2 ..................................................................................................................................... 43
BOOK SLIDES ..................................................................................................................................................... 44
SESSION 3 LINEAR PROGRAMMING ...................................................................................................................... 51
REVIEW QUESTIONS ......................................................................................................................................... 51
HOMEWORK ..................................................................................................................................................... 53
PROBLEMS ........................................................................................................................................................ 56
SLIDES ............................................................................................................................................................... 59
PREPARATION QUIZ 3 ........................................................................................................................................ 62
BOOK SLIDES ..................................................................................................................................................... 67
SESSION 4 NETWORK OPTIMIZATION & INTEGER PROGRAMMING ..................................................................... 69
REVIEW QUESTIONS ......................................................................................................................................... 69
HOMEWORK ..................................................................................................................................................... 70
PROBLEMS ........................................................................................................................................................ 74
SLIDES ............................................................................................................................................................... 76
PREPARATION QUIZ 4 ........................................................................................................................................ 77
BOOK SLIDES ..................................................................................................................................................... 79
SESSION 5 NONLINEAR PROGRAMMING & DECISION ANALYSIS .......................................................................... 82
REVIEW QUESTIONS ......................................................................................................................................... 82
HOMEWORK ..................................................................................................................................................... 83
PROBLEMS ........................................................................................................................................................ 86
SLIDES ............................................................................................................................................................... 89
PREPARATION QUIZ 5 ........................................................................................................................................ 92
BOOK SLIDES ..................................................................................................................................................... 95
, 2
SESSION 1 INTRODUCTION & EXCEL PRACTICUM
CHAPTER 1 & 2
- What is Management Science?
- What do some basic functions in Excel such as SUM, MIN, AVERAGE, STDEV.S, IF, SUMIF,
SUMPRODUCT do?
- How to filter and sort data in Excel?
- How to visualize data in Excel? How to make bar charts, histograms, boxplots, scatter plots,
line charts?
- How to compute correlation in Excel?
- How to run a regression in Excel?
REVIEW QUESTIONS
1.4.3: What intuitive property of the relationship between sales and advertising is not captured by
linear regression? There are often diminishing returns from advertising that are not captured by
linear regression.
1.4.4: What is the potential serious flaw of using the polynomial equation to predict sales? If a
polynomial equation is used to try to predict what sales will be for advertising budgets, it will
eventually start sloping downward. While we intuitively would expect diminishing returns as
advertising is increased, we wouldn’t expect sales to actually decrease.
1.4.5: What does the square-root effect suggest about the relationship between sales and
advertising? Sales do not increase proportionally with the level of advertising, but rather increase
proportionally with the square root of advertising. The square-root effect is a rule of thumb in
advertising suggesting that sales increase proportionally with the square root of advertising.
2.3.1: What are the four steps of descriptive analytics? Step 1: Gather and organize relevant data.
Step 2: Clean the data. Step 3: Explore the data. Step 4: Communicate performance information using
data visualization.
2.3.2: What has caused the data surge during this era of big data? The data surge has been a result
of sophisticated computer tracking of all of the organization’s internal transactions. The data also can
come flooding in from sources such as web traffic, social networks, sensors of various types, and
captures of audio and video recordings.
2.3.3: What is the difference between a numerical and categorical variable? Numerical variable= A
variable that takes on numerical values. The possible numerical values could be continuous (any
numerical or decimal value) or integer, usually within a given range. Categorical variable= A type of
variable that can take on only a small number of values that represent the few possible categories.
The values could be expressed either numerically (0 or 1) or with text. Categorical variables can be
further differentiated into either nominal variables (order of values have no meaning) or ordinal
variables (natural order in values).
2.3.4: Give three examples of types of errors that are corrected during data cleaning? For example,
missing data, improperly formatted data, and duplicated data.
2.4.4: What does the k-nearest-neighbours algorithm base its predictions upon? It uses the
observed behaviour of customers (for example) (the k nearest neighbours of this customer) to predict
what the prospective customer will do.
, 3
2.4.9: What does it mean to overfit to the data? A model that fits the historical data too precisely is
referred to as overfitting the data because it is overly accounting for the noise. Overfitting the data=
Making a predictive model less accurate when using new data sets by having the model align too
closely to the given data instead of taking into account the inherent idiosyncrasies in the given data
due to randomness.
A model that overfits to the historical data will incorporate and account for too much of the noise,
potentially to the point of missing the main signal, and therefore may make poor predictions with
new data.
2.4.11: What is the difference between specificity and sensitivity? Specificity= The ability to
correctly predict a negative outcome. Sensitivity= The ability to correctly predict a positive outcome.
HOMEWORK
1.9:
A: B:
, 4
C:
2.17:
2.18: