Applied Methods and Statistics
Contents
Lecture 1.....................................................................................................................................1
Lecture 2.....................................................................................................................................6
Lecture 3...................................................................................................................................15
Lecture 4 moderation................................................................................................................23
Lecture 5...................................................................................................................................33
Lecture 6...................................................................................................................................39
Lecture 7...................................................................................................................................45
Workgroup 4 CFA....................................................................................................................54
Lecture 8 Explorative Factor Analysis (EFA)..........................................................................58
Workgroup 4 Exploratory Factor Analysis..............................................................................66
Lecture 9...................................................................................................................................68
Lecture 10.................................................................................................................................83
Lecture 11.................................................................................................................................84
Lecture 1
This course is about how to use certain methods and techniques in order to investigate
(causal) theories about psychological processes based on empirical data and how to translate
a theory into a statistical model, how to apply the model to data and how to draw substantive
conclusion based on the model
Manifest variables = variables that are directly measurable / observable (e.g. age, income,
how many times you scratch your nose during an experiment, reaction time)
Latent variables = variables that are not directly observable but are measured with dedicated
instruments (IQ tests, personality tests, questionnaires, Depression Inventory etc.)
So, variables are properties of research that always vary. If there is no variation, then you
speak of a constant (e.g. if you have a study with only women, then gender is not a variable
but a constant).
- Common mistakes with variable:
o Confusing values of the same variable as two different variables (e.g. ‘rich’
and ‘poor’ are 2 values of the same variable income so you should not model
rich and poor separately)
,Experimental research: active manipulation of the independent variables and random
assignment to experimental conditions
Correlational research = studying coherence between variables obtained from surveys, field
observations. No manipulation has been taken place
Basic descriptive statistics (don’t need to calculate, only understand their meaning)
- Mean = average
- Variance = a measure of dispersion (how much variation is in the data), not
standardized, always a positive number
- Standard deviation = a measure of dispersion (how much variation in the data), a
standardized measure so can be positive or negative, allows you to compare studies
- Covariance = a measure of (linear) association, not standardized so you cannot say
how strong or weak an association is, only that there is a negative (below 0) or
positive association (above 0)
- Correlation = a measure of (linear) association that is standardized, you can say how
strong or weak an association is. Goes from -1 to +1
- Standardized scores
o Mean = 0
o SD = 1
o Variance = 1
Hypothesis = a statement about the supposed relationship between 2 or more variables > can
be either causal or correlational
Path Model = a hypothesis (prediction) about underlying causal processes that explain the
observed correlations between two or more variables > e.g. observed correlation between
number of Facebook friends and well-being is 0.64 (moderate to strong correlation). So, can
we use that if you make more Facebook friends, you will be happier? NO, correlation is not
causation! There may be numerous other explanations that can explain why having more
Facebook friends is associated with better well-being. So, we have to develop a theory on
why the two may be associated
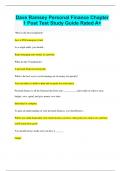
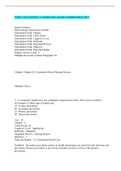
, - Possible explanation: people with many friends experience more social support which
leads a higher degree of well-being > so, we introduce a new variable that is put in the
middle of Facebook friends and subjective well-being
- Social support and well-being are both determined by:
- The degree of which you have a positive self-image
- The degree to which you have an honest image of yourself
- This theory can then be translated into a model like this:
-
So, the goal of path analysis is to explain why variables correlate with each other > e.g. if we
know that introverts are more susceptible to burnout, you can pay extra attention to them but
if we also know why that is the cause, we can maybe prevent it from happening altogether.
Each path model can be broken down into 5 fundamental relationships > these relationships
provide possible explanations for the observed correlation between variables (they are the
building blocks for a path model)
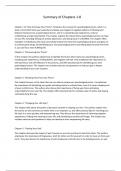
- Direct causal effect
- Hypothesis: Changes in X (directly) causes changes in Y
- The reverse does not hold! A change in Y has no effect on X (e.g. a higher salary (X)
causes motivation to be higher (Y). But, having more motivation for your job (Y)
does not lead to an (direct) increase in salary (X))
- Note: if the hypothesis is true, then we expect to see a correlation between X and Y.
That means that if there is no correlation, than a direct effect cannot exist (hypothesis
is rejected).
-
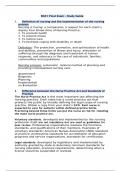
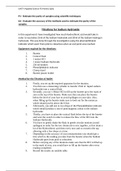
- The indirect effect
- Hypothesis: a change in X directly causes a change in M. A change in M directly
causes a change in Y
, - Result: a change in X causes an indirect change in Y
- Variable M = mediator / intervening variable since it mediates the relationship
between X and Y
-
- E.g. hypothesis 1 = the more negative thoughts, the less well people take care of
themselves and hypothesis 2 = the less well people take care of themselves, the less
good their health is
-
- Note: since the H1 and H2 are both direct hypotheses, it cannot be the case (according
to this model) that intervening on self-care has an effect on your negative thoughts.
However, this does not seem very plausible so always be critical of every model
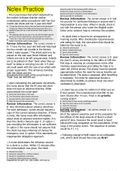
- Spurious relation
- Z is a common cause for both X and Y (there is a direct effect of Z on X and a direct
effect of Z on Y which causes X and Y to be correlated) > a change in X has no effect
on Y and a change in Y has no effect on X
-
- Variable Z is a confounder > correlational research is often aimed at detecting or
excluding possible confounders
- Example: Why is it the case that gaming and aggression are associated?
-
Contents
Lecture 1.....................................................................................................................................1
Lecture 2.....................................................................................................................................6
Lecture 3...................................................................................................................................15
Lecture 4 moderation................................................................................................................23
Lecture 5...................................................................................................................................33
Lecture 6...................................................................................................................................39
Lecture 7...................................................................................................................................45
Workgroup 4 CFA....................................................................................................................54
Lecture 8 Explorative Factor Analysis (EFA)..........................................................................58
Workgroup 4 Exploratory Factor Analysis..............................................................................66
Lecture 9...................................................................................................................................68
Lecture 10.................................................................................................................................83
Lecture 11.................................................................................................................................84
Lecture 1
This course is about how to use certain methods and techniques in order to investigate
(causal) theories about psychological processes based on empirical data and how to translate
a theory into a statistical model, how to apply the model to data and how to draw substantive
conclusion based on the model
Manifest variables = variables that are directly measurable / observable (e.g. age, income,
how many times you scratch your nose during an experiment, reaction time)
Latent variables = variables that are not directly observable but are measured with dedicated
instruments (IQ tests, personality tests, questionnaires, Depression Inventory etc.)
So, variables are properties of research that always vary. If there is no variation, then you
speak of a constant (e.g. if you have a study with only women, then gender is not a variable
but a constant).
- Common mistakes with variable:
o Confusing values of the same variable as two different variables (e.g. ‘rich’
and ‘poor’ are 2 values of the same variable income so you should not model
rich and poor separately)
,Experimental research: active manipulation of the independent variables and random
assignment to experimental conditions
Correlational research = studying coherence between variables obtained from surveys, field
observations. No manipulation has been taken place
Basic descriptive statistics (don’t need to calculate, only understand their meaning)
- Mean = average
- Variance = a measure of dispersion (how much variation is in the data), not
standardized, always a positive number
- Standard deviation = a measure of dispersion (how much variation in the data), a
standardized measure so can be positive or negative, allows you to compare studies
- Covariance = a measure of (linear) association, not standardized so you cannot say
how strong or weak an association is, only that there is a negative (below 0) or
positive association (above 0)
- Correlation = a measure of (linear) association that is standardized, you can say how
strong or weak an association is. Goes from -1 to +1
- Standardized scores
o Mean = 0
o SD = 1
o Variance = 1
Hypothesis = a statement about the supposed relationship between 2 or more variables > can
be either causal or correlational
Path Model = a hypothesis (prediction) about underlying causal processes that explain the
observed correlations between two or more variables > e.g. observed correlation between
number of Facebook friends and well-being is 0.64 (moderate to strong correlation). So, can
we use that if you make more Facebook friends, you will be happier? NO, correlation is not
causation! There may be numerous other explanations that can explain why having more
Facebook friends is associated with better well-being. So, we have to develop a theory on
why the two may be associated
, - Possible explanation: people with many friends experience more social support which
leads a higher degree of well-being > so, we introduce a new variable that is put in the
middle of Facebook friends and subjective well-being
- Social support and well-being are both determined by:
- The degree of which you have a positive self-image
- The degree to which you have an honest image of yourself
- This theory can then be translated into a model like this:
-
So, the goal of path analysis is to explain why variables correlate with each other > e.g. if we
know that introverts are more susceptible to burnout, you can pay extra attention to them but
if we also know why that is the cause, we can maybe prevent it from happening altogether.
Each path model can be broken down into 5 fundamental relationships > these relationships
provide possible explanations for the observed correlation between variables (they are the
building blocks for a path model)
- Direct causal effect
- Hypothesis: Changes in X (directly) causes changes in Y
- The reverse does not hold! A change in Y has no effect on X (e.g. a higher salary (X)
causes motivation to be higher (Y). But, having more motivation for your job (Y)
does not lead to an (direct) increase in salary (X))
- Note: if the hypothesis is true, then we expect to see a correlation between X and Y.
That means that if there is no correlation, than a direct effect cannot exist (hypothesis
is rejected).
-
- The indirect effect
- Hypothesis: a change in X directly causes a change in M. A change in M directly
causes a change in Y
, - Result: a change in X causes an indirect change in Y
- Variable M = mediator / intervening variable since it mediates the relationship
between X and Y
-
- E.g. hypothesis 1 = the more negative thoughts, the less well people take care of
themselves and hypothesis 2 = the less well people take care of themselves, the less
good their health is
-
- Note: since the H1 and H2 are both direct hypotheses, it cannot be the case (according
to this model) that intervening on self-care has an effect on your negative thoughts.
However, this does not seem very plausible so always be critical of every model
- Spurious relation
- Z is a common cause for both X and Y (there is a direct effect of Z on X and a direct
effect of Z on Y which causes X and Y to be correlated) > a change in X has no effect
on Y and a change in Y has no effect on X
-
- Variable Z is a confounder > correlational research is often aimed at detecting or
excluding possible confounders
- Example: Why is it the case that gaming and aggression are associated?
-