Please check the examination details below before entering your candidate information
Candidate surname Other names
Centre Number Candidate Number
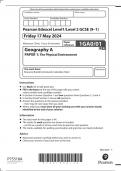
Pearson Edexcel Level 1/Level 2 GCSE (9−1)
Wednesday 5 June 2024
Morning (Time: 1 hour 30 minutes)
Paper
reference 1GA0/02
Geography A
PAPER 2: The Human Environment
You must have: Total Marks
Resource Booklet (enclosed), Calculator, ruler
Instructions
•• Use black ink or ball-point pen.
Fill in the boxes at the top of this page with your name,
centre number and candidate number.
•• InIn Section A and Section B answer all questions
Section C answer all of Question 3 and one question from
either Question 4 or Question 5.
• Answer the questions in the spaces provided
– there may be more space than you need.
• Where asked you must show all your working out with your answer clearly
identified at the end of your solution.
Information
•• The total mark for this paper is 94.
The marks for each question are shown in brackets
– use this as a guide as to how much time to spend on each question.
• The marks available for spelling, punctuation and grammar are clearly indicated.
Advice
•• Read each question carefully before you start to answer it.
Check your answers if you have time at the end.
Turn over
P75519A
©2024 Pearson Education Ltd.
F:1/1/1/1/1/1/1/1/1/1
*P75519A0124*
, SECTION A
Changing Cities
DO NOT WRITE IN THIS AREA DO NOT WRITE IN THIS AREA DO NOT WRITE IN THIS AREA
Answer ALL questions in this section. Write your answers in the spaces provided.
Some questions must be answered with a cross in a box . If you change your mind about an
answer, put a line through the box and then mark your new answer with a cross .
1 (a) Study Figure 1a in the Resource Booklet.
(i) Identify the country that had the largest increase in percentage urban
population between 1970 and 1985?
(1)
A Albania
B Ecuador
C Libya
D Mongolia
(ii) Identify Mongolia’s percentage urban population in 2010.
(1)
A 51%
B 62%
C 69%
D 78%
(iii) State two possible reasons for the overall trend in urbanisation shown in
Figure 1a.
(2)
1 . . . . . . . . .. .. .. .. .. .. .. .. .. .. . . . . . . . . . . . . . . . . . . . . . . . . . . . . . . . . . . . . . . . . . . . . . . . . . . . . . . . . . . . . . . . . . . . . . ............... ............................................................................................................................ ................ . . . . . . . . . . . . . . . . . . . .
. . . . . . . . . . . . .. .. .. .. .. .. .. .. .. .. . . . . . . . . . . . . . . . . . . . . . . . . . . . . . . . . . . . . . . . . . . . . . . . . . . . . . . . . . . . . . . . . . . . . . ............... ............................................................................................................................ .............. .. . . . . . . . . . . . . . . . . . . . .
2 . . . . . . . . .. .. .. .. .. .. .. .. .. .. . . . . . . . . . . . . . . . . . . . . . . . . . . . . . . . . . . . . . . . . . . . . . . . . . . . . . . . . . . . . . . . . . . . . . ............... ............................................................................................................................ ................ . . . . . . . . . . . . . . . . . . . .
. . . . . . . . . . . . .. .. .. .. .. .. .. .. .. .. . . . . . . . . . . . . . . . . . . . . . . . . . . . . . . . . . . . . . . . . . . . . . . . . . . . . . . . . . . . . . . . . . . . . . ............... ............................................................................................................................ .............. .. . . . . . . . . . . . . . . . . . . . .
2
*P75519A0224*
, UK cities are changing due to the movements of people, employment and services.
(b) Identify the term which is, “the movement of people back into urban areas where
DO NOT WRITE IN THIS AREA DO NOT WRITE IN THIS AREA DO NOT WRITE IN THIS AREA
populations had previously declined”.
(1)
A suburbanisation
B counter-urbanisation
C international migration
D re-urbanisation
(c) Study Figure 1b in the Resource Booklet.
(i) Describe the results of the survey shown in Figure 1b.
Use data in your answer.
(3)
. . . . . . . . . . . . .. .. .. .. .. .. .. .. .. .. . . . . . . . . . . . . . . . . . . . . . . . . . . . . . . . . . . . . . . . . . . . . . . . . . . . . . . . . . . . . . . . . . . . . ................ ............................................................................................................................ ................ . . . . . . . . . . . . . . . . . . . .
. . . . . . . . . . . . .. .. .. .. .. .. .. .. .. .. . . . . . . . . . . . . . . . . . . . . . . . . . . . . . . . . . . . . . . . . . . . . . . . . . . . . . . . . . . . . . . . . . . . . ................ ............................................................................................................................ ................ . . . . . . . . . . . . . . . . . . . .
. . . . . . . . . . . . .. .. .. .. .. .. .. .. .. .. . . . . . . . . . . . . . . . . . . . . . . . . . . . . . . . . . . . . . . . . . . . . . . . . . . . . . . . . . . . . . . . . . . . . ................ ............................................................................................................................ ................ . . . . . . . . . . . . . . . . . . . .
. . . . . . . . . . . . .. .. .. .. .. .. .. .. .. .. . . . . . . . . . . . . . . . . . . . . . . . . . . . . . . . . . . . . . . . . . . . . . . . . . . . . . . . . . . . . . . . . . . . . ................ ............................................................................................................................ ................ . . . . . . . . . . . . . . . . . . . .
. . . . . . . . . . . . .. .. .. .. .. .. .. .. .. .. . . . . . . . . . . . . . . . . . . . . . . . . . . . . . . . . . . . . . . . . . . . . . . . . . . . . . . . . . . . . . . . . . . . . ................ ............................................................................................................................ ................ . . . . . . . . . . . . . . . . . . . .
. . . . . . . . . . . . .. .. .. .. .. .. .. .. .. .. . . . . . . . . . . . . . . . . . . . . . . . . . . . . . . . . . . . . . . . . . . . . . . . . . . . . . . . . . . . . . . . . . . . . ................ ............................................................................................................................ ................ . . . . . . . . . . . . . . . . . . . .
(ii) Explain one positive impact of migration on cities.
(2)
. . . . . . . . . . . . .. .. .. .. .. .. .. .. .. .. . . . . . . . . . . . . . . . . . . . . . . . . . . . . . . . . . . . . . . . . . . . . . . . . . . . . . . . . . . . . . . . . . . . . ................ ............................................................................................................................ ................ . . . . . . . . . . . . . . . . . . . .
. . . . . . . . . . . . .. .. .. .. .. .. .. .. .. .. . . . . . . . . . . . . . . . . . . . . . . . . . . . . . . . . . . . . . . . . . . . . . . . . . . . . . . . . . . . . . . . . . . . . ................ ............................................................................................................................ ................ . . . . . . . . . . . . . . . . . . . .
. . . . . . . . . . . . .. .. .. .. .. .. .. .. .. .. . . . . . . . . . . . . . . . . . . . . . . . . . . . . . . . . . . . . . . . . . . . . . . . . . . . . . . . . . . . . . . . . . . . . ................ ............................................................................................................................ ................ . . . . . . . . . . . . . . . . . . . .
. . . . . . . . . . . . .. .. .. .. .. .. .. .. .. .. . . . . . . . . . . . . . . . . . . . . . . . . . . . . . . . . . . . . . . . . . . . . . . . . . . . . . . . . . . . . . . . . . . . . ................ ............................................................................................................................ ................ . . . . . . . . . . . . . . . . . . . .
3
*P75519A0324* Turn over
, (d) Study Figure 1c in the Resource Booklet.
(i) Calculate the median percentage increase in population shown on Figure 1c.
DO NOT WRITE IN THIS AREA DO NOT WRITE IN THIS AREA DO NOT WRITE IN THIS AREA
Write your answer to one decimal place.
You must show your working in the space below.
(2)
................ . . . . . . . . . . . . . . . %
(ii) In Wolverhampton, another UK city, there was a population increase from
249,500 in 2011 to 263,700 in 2021.
Calculate the percentage increase in the population of Wolverhampton
between 2011 and 2021.
Write your answer to one decimal place.
You must show your working in the space below.
(2)
................ . . . . . . . . . . . . . . . %
4
*P75519A0424*
Candidate surname Other names
Centre Number Candidate Number
Pearson Edexcel Level 1/Level 2 GCSE (9−1)
Wednesday 5 June 2024
Morning (Time: 1 hour 30 minutes)
Paper
reference 1GA0/02
Geography A
PAPER 2: The Human Environment
You must have: Total Marks
Resource Booklet (enclosed), Calculator, ruler
Instructions
•• Use black ink or ball-point pen.
Fill in the boxes at the top of this page with your name,
centre number and candidate number.
•• InIn Section A and Section B answer all questions
Section C answer all of Question 3 and one question from
either Question 4 or Question 5.
• Answer the questions in the spaces provided
– there may be more space than you need.
• Where asked you must show all your working out with your answer clearly
identified at the end of your solution.
Information
•• The total mark for this paper is 94.
The marks for each question are shown in brackets
– use this as a guide as to how much time to spend on each question.
• The marks available for spelling, punctuation and grammar are clearly indicated.
Advice
•• Read each question carefully before you start to answer it.
Check your answers if you have time at the end.
Turn over
P75519A
©2024 Pearson Education Ltd.
F:1/1/1/1/1/1/1/1/1/1
*P75519A0124*
, SECTION A
Changing Cities
DO NOT WRITE IN THIS AREA DO NOT WRITE IN THIS AREA DO NOT WRITE IN THIS AREA
Answer ALL questions in this section. Write your answers in the spaces provided.
Some questions must be answered with a cross in a box . If you change your mind about an
answer, put a line through the box and then mark your new answer with a cross .
1 (a) Study Figure 1a in the Resource Booklet.
(i) Identify the country that had the largest increase in percentage urban
population between 1970 and 1985?
(1)
A Albania
B Ecuador
C Libya
D Mongolia
(ii) Identify Mongolia’s percentage urban population in 2010.
(1)
A 51%
B 62%
C 69%
D 78%
(iii) State two possible reasons for the overall trend in urbanisation shown in
Figure 1a.
(2)
1 . . . . . . . . .. .. .. .. .. .. .. .. .. .. . . . . . . . . . . . . . . . . . . . . . . . . . . . . . . . . . . . . . . . . . . . . . . . . . . . . . . . . . . . . . . . . . . . . . ............... ............................................................................................................................ ................ . . . . . . . . . . . . . . . . . . . .
. . . . . . . . . . . . .. .. .. .. .. .. .. .. .. .. . . . . . . . . . . . . . . . . . . . . . . . . . . . . . . . . . . . . . . . . . . . . . . . . . . . . . . . . . . . . . . . . . . . . . ............... ............................................................................................................................ .............. .. . . . . . . . . . . . . . . . . . . . .
2 . . . . . . . . .. .. .. .. .. .. .. .. .. .. . . . . . . . . . . . . . . . . . . . . . . . . . . . . . . . . . . . . . . . . . . . . . . . . . . . . . . . . . . . . . . . . . . . . . ............... ............................................................................................................................ ................ . . . . . . . . . . . . . . . . . . . .
. . . . . . . . . . . . .. .. .. .. .. .. .. .. .. .. . . . . . . . . . . . . . . . . . . . . . . . . . . . . . . . . . . . . . . . . . . . . . . . . . . . . . . . . . . . . . . . . . . . . . ............... ............................................................................................................................ .............. .. . . . . . . . . . . . . . . . . . . . .
2
*P75519A0224*
, UK cities are changing due to the movements of people, employment and services.
(b) Identify the term which is, “the movement of people back into urban areas where
DO NOT WRITE IN THIS AREA DO NOT WRITE IN THIS AREA DO NOT WRITE IN THIS AREA
populations had previously declined”.
(1)
A suburbanisation
B counter-urbanisation
C international migration
D re-urbanisation
(c) Study Figure 1b in the Resource Booklet.
(i) Describe the results of the survey shown in Figure 1b.
Use data in your answer.
(3)
. . . . . . . . . . . . .. .. .. .. .. .. .. .. .. .. . . . . . . . . . . . . . . . . . . . . . . . . . . . . . . . . . . . . . . . . . . . . . . . . . . . . . . . . . . . . . . . . . . . . ................ ............................................................................................................................ ................ . . . . . . . . . . . . . . . . . . . .
. . . . . . . . . . . . .. .. .. .. .. .. .. .. .. .. . . . . . . . . . . . . . . . . . . . . . . . . . . . . . . . . . . . . . . . . . . . . . . . . . . . . . . . . . . . . . . . . . . . . ................ ............................................................................................................................ ................ . . . . . . . . . . . . . . . . . . . .
. . . . . . . . . . . . .. .. .. .. .. .. .. .. .. .. . . . . . . . . . . . . . . . . . . . . . . . . . . . . . . . . . . . . . . . . . . . . . . . . . . . . . . . . . . . . . . . . . . . . ................ ............................................................................................................................ ................ . . . . . . . . . . . . . . . . . . . .
. . . . . . . . . . . . .. .. .. .. .. .. .. .. .. .. . . . . . . . . . . . . . . . . . . . . . . . . . . . . . . . . . . . . . . . . . . . . . . . . . . . . . . . . . . . . . . . . . . . . ................ ............................................................................................................................ ................ . . . . . . . . . . . . . . . . . . . .
. . . . . . . . . . . . .. .. .. .. .. .. .. .. .. .. . . . . . . . . . . . . . . . . . . . . . . . . . . . . . . . . . . . . . . . . . . . . . . . . . . . . . . . . . . . . . . . . . . . . ................ ............................................................................................................................ ................ . . . . . . . . . . . . . . . . . . . .
. . . . . . . . . . . . .. .. .. .. .. .. .. .. .. .. . . . . . . . . . . . . . . . . . . . . . . . . . . . . . . . . . . . . . . . . . . . . . . . . . . . . . . . . . . . . . . . . . . . . ................ ............................................................................................................................ ................ . . . . . . . . . . . . . . . . . . . .
(ii) Explain one positive impact of migration on cities.
(2)
. . . . . . . . . . . . .. .. .. .. .. .. .. .. .. .. . . . . . . . . . . . . . . . . . . . . . . . . . . . . . . . . . . . . . . . . . . . . . . . . . . . . . . . . . . . . . . . . . . . . ................ ............................................................................................................................ ................ . . . . . . . . . . . . . . . . . . . .
. . . . . . . . . . . . .. .. .. .. .. .. .. .. .. .. . . . . . . . . . . . . . . . . . . . . . . . . . . . . . . . . . . . . . . . . . . . . . . . . . . . . . . . . . . . . . . . . . . . . ................ ............................................................................................................................ ................ . . . . . . . . . . . . . . . . . . . .
. . . . . . . . . . . . .. .. .. .. .. .. .. .. .. .. . . . . . . . . . . . . . . . . . . . . . . . . . . . . . . . . . . . . . . . . . . . . . . . . . . . . . . . . . . . . . . . . . . . . ................ ............................................................................................................................ ................ . . . . . . . . . . . . . . . . . . . .
. . . . . . . . . . . . .. .. .. .. .. .. .. .. .. .. . . . . . . . . . . . . . . . . . . . . . . . . . . . . . . . . . . . . . . . . . . . . . . . . . . . . . . . . . . . . . . . . . . . . ................ ............................................................................................................................ ................ . . . . . . . . . . . . . . . . . . . .
3
*P75519A0324* Turn over
, (d) Study Figure 1c in the Resource Booklet.
(i) Calculate the median percentage increase in population shown on Figure 1c.
DO NOT WRITE IN THIS AREA DO NOT WRITE IN THIS AREA DO NOT WRITE IN THIS AREA
Write your answer to one decimal place.
You must show your working in the space below.
(2)
................ . . . . . . . . . . . . . . . %
(ii) In Wolverhampton, another UK city, there was a population increase from
249,500 in 2011 to 263,700 in 2021.
Calculate the percentage increase in the population of Wolverhampton
between 2011 and 2021.
Write your answer to one decimal place.
You must show your working in the space below.
(2)
................ . . . . . . . . . . . . . . . %
4
*P75519A0424*