Pearson Edexcel Level 1/Level 2 GCSE (9−1) Geography A PAPER 2: The Human Environment Qu
Paper 2023
surname names
Number Number
Morning (Time: 1 hour 30 minutes) Paper
A
Instructions
•• Use black ink or ball-point pen.
Fill in the boxes at the top of this page with your name,
centre number and candidate number.
•• InIn Section A and Section B answer all questions.
Section C answer all of Question 3 and one question from either Question 4 or
• – there may be more space than you need.
Question 5.
Answer the questions in the spaces provided
• Where asked you must show all your working out with your answer clearly
identified at the end of your solution.
Information
•• The total mark for this paper is 94.
The marks for each question are shown in brackets
– use this as a guide as to how much time to spend on each question.
• The marks available for spelling, punctuation and grammar are clearly indicated.
Advice
•• Read each question carefully before you start to answer it.
Check your answers if you have time at the end.
Turn over
, SECTION A
Changing Cities
Answer ALL questions in this section.
Write your answers in the spaces provided.
Some questions must be answered with a cross in a box . If you change your mind about an
answer, put a line through the box and then mark your new answer with a cross .
1 The causes and effects of urbanisation can vary between countries at different levels
of developmen t.
(a) Study Figure 1a in the Resource Booklet.
(i) Identify the percentage (%) of Australia’s total population living in urban areas.
(1)
A Between 10% and 20%
B Between 20% and 30%
C Between 30% and 40%
D Between 80% and 90%
(ii) Name the country labelled on Figure 1a that has between 50% and 60% of its
total population living in urban areas.
(1)
. ..... ... ... .... . .. .... . . . .... .. ... ..... . .... ... . .... .. ... ..... . ... .... . ... .... . .. .... . . .... ... . .... .. . .... ... . ... .... . . .... .. . .... .. . ... .... . . .... .. . .... ... ... ..... ... ..... .... .... .... ... . ... .... ... .. ... . ..... .. . .... ... ... .... ... ..... . .. .... . . . .... .. ... ......................
(iii) Explain one reason why some countries have low percentages (%) of their
population living in urban areas.
(2)
. ..... ... ... .... . .. .... . . . .... .. ... ..... . .... ... . .... .. ... ..... . ... .... . ... .... . .. .... . . .... ... . .... .. . .... ... . ... .... . . .... .. . .... .. . ... .... . . .... .. . .... ... ... ..... ... ..... .... .... .... ... . ... .... ... .. ... . ..... .. . .... ... ... .... ... ..... . .. .... . . . .... .. ... ......................
. ..... ... ... .... . .. .... . . . .... .. ... ..... . .... ... . .... .. ... ..... . ... .... . ... .... . .. .... . . .... ... . .... .. . .... ... . ... .... . . .... .. . .... .. . ... .... . . .... .. . .... ... ... ..... ... ..... .... .... .... ... . ... .... ... .. ... . ..... .. . .... ... ... .... ... ..... . .. .... . . . .... .. ... ......................
. ..... ... ... .... . .. .... . . . .... .. ... ..... . .... ... . .... .. ... ..... . ... .... . ... .... . .. .... . . .... ... . .... .. . .... ... . ... .... . . .... .. . .... .. . ... .... . . .... .. . .... ... ... ..... ... ..... .... .... .... ... . ... .... ... .. ... . ..... .. . .... ... ... .... ... ..... . .. .... . . . .... .. ... ......................
. ..... ... ... .... . .. .... . . . .... .. ... ..... . .... ... . .... .. ... ..... . ... .... . ... .... . .. .... . . .... ... . .... .. . .... ... . ... .... . . .... .. . .... .. . ... .... . . .... .. . .... ... ... ..... ... ..... .... .... .... ... . ... .... ... .. ... . ..... .. . .... ... ... .... ... ..... . .. .... . . . .... .. ... ......................
2
, (b) Study Figure 1b in the Resource Booklet.
Compare the changes in the urban populations of Asia and North America
DO NOT WRITE IN THIS AREA
DO NOT WRITE IN THIS AREA
between 1950 and 2020.
(3)
. . . .. . .. . .. . .. . .. . .. . .. . .. . .. . .. . .. . .. . .. . .. . .. . .. . .. . .. . .. . .. . .. . .. .. . . .. . .. . .. . .. . .. . .. . .. . .. . .. . .. . .. . .. . .. . .. . .. . .. . .. . .. . . .. . .. .. . . .. . .. . .. . .. . .. . .. . .. . .. . .. . .. . .. . .. . .. . .. . .. . .. . .. . .. . .. . .. . .. . .. .. . . .. . .. . .. . .. . .. . .. . .. . .. . .. . .. . .. . .. . .. . .. . .. . .. . . ......................
. . . .. . .. . .. . .. . .. . .. . .. . .. . .. . .. . .. . .. . .. . .. . .. . .. . .. . .. . .. . .. . .. . .. .. . . .. . .. . .. . .. . .. . .. . .. . .. . .. . .. . .. . .. . .. . .. . .. . .. . .. . .. . . .. . .. .. . . .. . .. . .. . .. . .. . .. . .. . .. . .. . .. . .. . .. . .. . .. . .. . .. . .. . .. . .. . .. . .. . .. .. . . .. . .. . .. . .. . .. . .. . .. . .. . .. . .. . .. . .. . .. . .. . .. . .. . . ......................
. . . .. . .. . .. . .. . .. . .. . .. . .. . .. . .. . .. . .. . .. . .. . .. . .. . .. . .. . .. . .. . .. . .. .. . . .. . .. . .. . .. . .. . .. . .. . .. . .. . . . . .. . .. . .. . .. . .. . .. . .. . .. . . .. . .. .. . . .. . .. . .. . .. . .. . .. . .. . .. . .. . .. . .. . .. . .. . .. . .. . .. . .. . .. . .. . .. . .. . .. .. . . .. . .. . .. . .. . .. . .. . .. . .. . .. . .. . .. . .. . .. . .. . .. . .. . . ......................
. . . .. . .. . .. . .. . .. . .. . .. . .. . .. . .. . .. . .. . .. . .. . .. . .. . .. . .. . .. . .. . .. . .. .. . . .. . .. . .. . .. . .. . .. . .. . .. . .. . .. . .. . .. . .. . .. . .. . .. . .. . .. . . .. . .. .. . . .. . .. . .. . .. . .. . .. . .. . .. . .. . .. . .. . .. . .. . .. . .. . .. . .. . .. . .. . .. . .. . .. .. . . .. . .. . .. . .. . .. . .. . .. . .. . .. . .. . .. . .. . .. . .. . .. . .. . . ......................
. . . .. . .. . .. . .. . .. . .. . .. . .. . .. . .. . .. . .. . .. . .. . .. . .. . .. . .. . .. . .. . .. . .. .. . . .. . .. . .. . .. . .. . .. . .. . .. . .. . .. . .. . .. . .. . .. . .. . .. . .. . .. . . .. . .. .. . . .. . .. . .. . .. . .. . .. . .. . .. . .. . .. . .. . .. . .. . .. . .. . .. . .. . .. . .. . .. . .. . .. .. . . .. . .. . .. . .. . .. . .. . .. . .. . .. . .. . .. . .. . .. . .. . .. . .. . . ......................
. . . .. . .. . .. . .. . .. . .. . .. . .. . .. . .. . .. . .. . .. . .. . .. . .. . .. . .. . .. . .. . .. . .. .. . . .. . .. . .. . .. . .. . .. . .. . .. . .. . .. . .. . .. . .. . .. . .. . .. . .. . .. . . .. . .. .. . . .. . .. . .. . .. . .. . .. . .. . .. . .. . .. . .. . .. . .. . .. . .. . .. . .. . .. . .. . .. . .. . .. .. . . .. . .. . .. . .. . .. . .. . .. . .. . .. . .. . .. . .. . .. . .. . .. . .. . . ......................
(c) Explain one reason why suburbanisation has taken place in the UK.
(2)
DO NOT WRITE IN THIS AREA
DO NOT WRITE IN THIS AREA
. . . .. . .. . .. . .. . .. . .. . .. . .. . .. . .. . .. . .. . .. . .. . .. . .. . .. . .. . .. . .. . .. . .. .. . . .. . .. . .. . .. . .. . .. . .. . .. . .. . .. . .. . .. . .. . .. . .. . .. . .. . .. . . .. . .. .. . . .. . .. . .. . .. . .. . .. . .. . .. . .. . .. . .. . .. . .. . .. . .. . .. . .. . .. . .. . .. . .. . .. .. . . .. . .. . .. . .. . .. . .. . .. . .. . .. . .. . .. . .. . .. . .. . .. . .. . . ......................
. . . .. . .. . .. . .. . .. . .. . .. . .. . .. . .. . .. . .. . .. . .. . .. . .. . .. . .. . .. . .. . .. . .. .. . . .. . .. . .. . .. . .. . .. . .. . .. . .. . .. . .. . .. . .. . .. . .. . .. . .. . .. . . .. . .. .. . . .. . .. . .. . .. . .. . .. . .. . .. . .. . .. . .. . .. . .. . .. . .. . .. . .. . .. . .. . .. . .. . .. .. . . .. . .. . .. . .. . .. . .. . .. . .. . .. . .. . .. . .. . .. . .. . .. . .. . . ......................
. . . .. . .. . .. . .. . .. . .. . .. . .. . .. . .. . .. . .. . .. . .. . .. . .. . .. . .. . .. . .. . .. . .. .. . . .. . .. . .. . .. . .. . .. . .. . .. . .. . . . . .. . .. . .. . .. . .. . .. . .. . .. . . .. . .. .. . . .. . .. . .. . .. . .. . .. . .. . .. . .. . .. . .. . .. . .. . .. . .. . .. . .. . .. . .. . .. . .. . .. .. . . .. . .. . .. . .. . .. . .. . .. . .. . .. . .. . .. . .. . .. . .. . .. . .. . . ......................
. . . .. . .. . .. . .. . .. . .. . .. . .. . .. . .. . .. . .. . .. . .. . .. . .. . .. . .. . .. . .. . .. . .. .. . . .. . .. . .. . .. . .. . .. . .. . .. . .. . .. . .. . .. . .. . .. . .. . .. . .. . .. . . .. . .. .. . . .. . .. . .. . .. . .. . .. . .. . .. . .. . .. . .. . .. . .. . .. . .. . .. . .. . .. . .. . .. . .. . .. .. . . .. . .. . .. . .. . .. . .. . .. . .. . .. . .. . .. . .. . .. . .. . .. . .. . . ......................
DO NOT WRITE IN THIS AREA
DO NOT WRITE IN THIS AREA
3
, The city of Kolkata is in India, an emerging country.
(d) Study Figure 1c below.
15
14
13
12
11
10
9
Population 8
(millions)
7
6
5
4
3
2
1
0
1980 1985 1990 1995 2000 2005 2010 2015 2020
Year
Figure 1c
Population growth of Kolkata between 1980 and 2020
(i) Complete Figure 1c by plotting the data from the table below.
(2)
Year Population (millions)
1990 11.0
2015 14.4
4
Paper 2023
surname names
Number Number
Morning (Time: 1 hour 30 minutes) Paper
A
Instructions
•• Use black ink or ball-point pen.
Fill in the boxes at the top of this page with your name,
centre number and candidate number.
•• InIn Section A and Section B answer all questions.
Section C answer all of Question 3 and one question from either Question 4 or
• – there may be more space than you need.
Question 5.
Answer the questions in the spaces provided
• Where asked you must show all your working out with your answer clearly
identified at the end of your solution.
Information
•• The total mark for this paper is 94.
The marks for each question are shown in brackets
– use this as a guide as to how much time to spend on each question.
• The marks available for spelling, punctuation and grammar are clearly indicated.
Advice
•• Read each question carefully before you start to answer it.
Check your answers if you have time at the end.
Turn over
, SECTION A
Changing Cities
Answer ALL questions in this section.
Write your answers in the spaces provided.
Some questions must be answered with a cross in a box . If you change your mind about an
answer, put a line through the box and then mark your new answer with a cross .
1 The causes and effects of urbanisation can vary between countries at different levels
of developmen t.
(a) Study Figure 1a in the Resource Booklet.
(i) Identify the percentage (%) of Australia’s total population living in urban areas.
(1)
A Between 10% and 20%
B Between 20% and 30%
C Between 30% and 40%
D Between 80% and 90%
(ii) Name the country labelled on Figure 1a that has between 50% and 60% of its
total population living in urban areas.
(1)
. ..... ... ... .... . .. .... . . . .... .. ... ..... . .... ... . .... .. ... ..... . ... .... . ... .... . .. .... . . .... ... . .... .. . .... ... . ... .... . . .... .. . .... .. . ... .... . . .... .. . .... ... ... ..... ... ..... .... .... .... ... . ... .... ... .. ... . ..... .. . .... ... ... .... ... ..... . .. .... . . . .... .. ... ......................
(iii) Explain one reason why some countries have low percentages (%) of their
population living in urban areas.
(2)
. ..... ... ... .... . .. .... . . . .... .. ... ..... . .... ... . .... .. ... ..... . ... .... . ... .... . .. .... . . .... ... . .... .. . .... ... . ... .... . . .... .. . .... .. . ... .... . . .... .. . .... ... ... ..... ... ..... .... .... .... ... . ... .... ... .. ... . ..... .. . .... ... ... .... ... ..... . .. .... . . . .... .. ... ......................
. ..... ... ... .... . .. .... . . . .... .. ... ..... . .... ... . .... .. ... ..... . ... .... . ... .... . .. .... . . .... ... . .... .. . .... ... . ... .... . . .... .. . .... .. . ... .... . . .... .. . .... ... ... ..... ... ..... .... .... .... ... . ... .... ... .. ... . ..... .. . .... ... ... .... ... ..... . .. .... . . . .... .. ... ......................
. ..... ... ... .... . .. .... . . . .... .. ... ..... . .... ... . .... .. ... ..... . ... .... . ... .... . .. .... . . .... ... . .... .. . .... ... . ... .... . . .... .. . .... .. . ... .... . . .... .. . .... ... ... ..... ... ..... .... .... .... ... . ... .... ... .. ... . ..... .. . .... ... ... .... ... ..... . .. .... . . . .... .. ... ......................
. ..... ... ... .... . .. .... . . . .... .. ... ..... . .... ... . .... .. ... ..... . ... .... . ... .... . .. .... . . .... ... . .... .. . .... ... . ... .... . . .... .. . .... .. . ... .... . . .... .. . .... ... ... ..... ... ..... .... .... .... ... . ... .... ... .. ... . ..... .. . .... ... ... .... ... ..... . .. .... . . . .... .. ... ......................
2
, (b) Study Figure 1b in the Resource Booklet.
Compare the changes in the urban populations of Asia and North America
DO NOT WRITE IN THIS AREA
DO NOT WRITE IN THIS AREA
between 1950 and 2020.
(3)
. . . .. . .. . .. . .. . .. . .. . .. . .. . .. . .. . .. . .. . .. . .. . .. . .. . .. . .. . .. . .. . .. . .. .. . . .. . .. . .. . .. . .. . .. . .. . .. . .. . .. . .. . .. . .. . .. . .. . .. . .. . .. . . .. . .. .. . . .. . .. . .. . .. . .. . .. . .. . .. . .. . .. . .. . .. . .. . .. . .. . .. . .. . .. . .. . .. . .. . .. .. . . .. . .. . .. . .. . .. . .. . .. . .. . .. . .. . .. . .. . .. . .. . .. . .. . . ......................
. . . .. . .. . .. . .. . .. . .. . .. . .. . .. . .. . .. . .. . .. . .. . .. . .. . .. . .. . .. . .. . .. . .. .. . . .. . .. . .. . .. . .. . .. . .. . .. . .. . .. . .. . .. . .. . .. . .. . .. . .. . .. . . .. . .. .. . . .. . .. . .. . .. . .. . .. . .. . .. . .. . .. . .. . .. . .. . .. . .. . .. . .. . .. . .. . .. . .. . .. .. . . .. . .. . .. . .. . .. . .. . .. . .. . .. . .. . .. . .. . .. . .. . .. . .. . . ......................
. . . .. . .. . .. . .. . .. . .. . .. . .. . .. . .. . .. . .. . .. . .. . .. . .. . .. . .. . .. . .. . .. . .. .. . . .. . .. . .. . .. . .. . .. . .. . .. . .. . . . . .. . .. . .. . .. . .. . .. . .. . .. . . .. . .. .. . . .. . .. . .. . .. . .. . .. . .. . .. . .. . .. . .. . .. . .. . .. . .. . .. . .. . .. . .. . .. . .. . .. .. . . .. . .. . .. . .. . .. . .. . .. . .. . .. . .. . .. . .. . .. . .. . .. . .. . . ......................
. . . .. . .. . .. . .. . .. . .. . .. . .. . .. . .. . .. . .. . .. . .. . .. . .. . .. . .. . .. . .. . .. . .. .. . . .. . .. . .. . .. . .. . .. . .. . .. . .. . .. . .. . .. . .. . .. . .. . .. . .. . .. . . .. . .. .. . . .. . .. . .. . .. . .. . .. . .. . .. . .. . .. . .. . .. . .. . .. . .. . .. . .. . .. . .. . .. . .. . .. .. . . .. . .. . .. . .. . .. . .. . .. . .. . .. . .. . .. . .. . .. . .. . .. . .. . . ......................
. . . .. . .. . .. . .. . .. . .. . .. . .. . .. . .. . .. . .. . .. . .. . .. . .. . .. . .. . .. . .. . .. . .. .. . . .. . .. . .. . .. . .. . .. . .. . .. . .. . .. . .. . .. . .. . .. . .. . .. . .. . .. . . .. . .. .. . . .. . .. . .. . .. . .. . .. . .. . .. . .. . .. . .. . .. . .. . .. . .. . .. . .. . .. . .. . .. . .. . .. .. . . .. . .. . .. . .. . .. . .. . .. . .. . .. . .. . .. . .. . .. . .. . .. . .. . . ......................
. . . .. . .. . .. . .. . .. . .. . .. . .. . .. . .. . .. . .. . .. . .. . .. . .. . .. . .. . .. . .. . .. . .. .. . . .. . .. . .. . .. . .. . .. . .. . .. . .. . .. . .. . .. . .. . .. . .. . .. . .. . .. . . .. . .. .. . . .. . .. . .. . .. . .. . .. . .. . .. . .. . .. . .. . .. . .. . .. . .. . .. . .. . .. . .. . .. . .. . .. .. . . .. . .. . .. . .. . .. . .. . .. . .. . .. . .. . .. . .. . .. . .. . .. . .. . . ......................
(c) Explain one reason why suburbanisation has taken place in the UK.
(2)
DO NOT WRITE IN THIS AREA
DO NOT WRITE IN THIS AREA
. . . .. . .. . .. . .. . .. . .. . .. . .. . .. . .. . .. . .. . .. . .. . .. . .. . .. . .. . .. . .. . .. . .. .. . . .. . .. . .. . .. . .. . .. . .. . .. . .. . .. . .. . .. . .. . .. . .. . .. . .. . .. . . .. . .. .. . . .. . .. . .. . .. . .. . .. . .. . .. . .. . .. . .. . .. . .. . .. . .. . .. . .. . .. . .. . .. . .. . .. .. . . .. . .. . .. . .. . .. . .. . .. . .. . .. . .. . .. . .. . .. . .. . .. . .. . . ......................
. . . .. . .. . .. . .. . .. . .. . .. . .. . .. . .. . .. . .. . .. . .. . .. . .. . .. . .. . .. . .. . .. . .. .. . . .. . .. . .. . .. . .. . .. . .. . .. . .. . .. . .. . .. . .. . .. . .. . .. . .. . .. . . .. . .. .. . . .. . .. . .. . .. . .. . .. . .. . .. . .. . .. . .. . .. . .. . .. . .. . .. . .. . .. . .. . .. . .. . .. .. . . .. . .. . .. . .. . .. . .. . .. . .. . .. . .. . .. . .. . .. . .. . .. . .. . . ......................
. . . .. . .. . .. . .. . .. . .. . .. . .. . .. . .. . .. . .. . .. . .. . .. . .. . .. . .. . .. . .. . .. . .. .. . . .. . .. . .. . .. . .. . .. . .. . .. . .. . . . . .. . .. . .. . .. . .. . .. . .. . .. . . .. . .. .. . . .. . .. . .. . .. . .. . .. . .. . .. . .. . .. . .. . .. . .. . .. . .. . .. . .. . .. . .. . .. . .. . .. .. . . .. . .. . .. . .. . .. . .. . .. . .. . .. . .. . .. . .. . .. . .. . .. . .. . . ......................
. . . .. . .. . .. . .. . .. . .. . .. . .. . .. . .. . .. . .. . .. . .. . .. . .. . .. . .. . .. . .. . .. . .. .. . . .. . .. . .. . .. . .. . .. . .. . .. . .. . .. . .. . .. . .. . .. . .. . .. . .. . .. . . .. . .. .. . . .. . .. . .. . .. . .. . .. . .. . .. . .. . .. . .. . .. . .. . .. . .. . .. . .. . .. . .. . .. . .. . .. .. . . .. . .. . .. . .. . .. . .. . .. . .. . .. . .. . .. . .. . .. . .. . .. . .. . . ......................
DO NOT WRITE IN THIS AREA
DO NOT WRITE IN THIS AREA
3
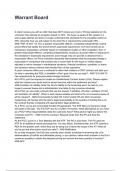
, The city of Kolkata is in India, an emerging country.
(d) Study Figure 1c below.
15
14
13
12
11
10
9
Population 8
(millions)
7
6
5
4
3
2
1
0
1980 1985 1990 1995 2000 2005 2010 2015 2020
Year
Figure 1c
Population growth of Kolkata between 1980 and 2020
(i) Complete Figure 1c by plotting the data from the table below.
(2)
Year Population (millions)
1990 11.0
2015 14.4
4