AQA
GCSE
GEOGRAPHY
Paper 1 Living with the Physical
Environment
May 2023
, 2
Do not write
outside the
box
For the multiple-choice questions, shade the circle next to the correct answer.
CORRECT METHOD WRONG METHODS
If you want to change your answer you must cross out your original answer as shown.
If you wish to return to an answer previously crossed out, ring the answer you now wish to
select as shown.
Section A The challenge of natural hazards
Answer all questions in this section.
Question 1 The challenge of natural hazards
0 1 . 1 Which one of the following is a natural factor affecting climate change?
Shade one circle only.
[1 mark]
A Agriculture
B Burning fossil fuels
C Deforestation
D Volcanic activity
G/Jun23/8035/1
, 3
Do not write
outside the
box
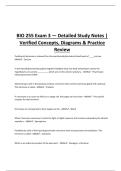
Study Figure 1, a graph showing average monthly Arctic sea ice extent in
September between 1980 and 2020.
Figure 1
8
7
6
Arctic sea
ice extent
(million km2)
5
4
3
1980 1990 2000 2010 2020
Year
0 1 . 2 Using Figure 1, which one of the following statements is true?
Shade one circle only.
[1 mark]
A The sea ice extent in 1980 and 2000 was the same.
B The sea ice reached its smallest extent in 2012.
C The sea ice decreased every year between 1980 and 1996.
D The sea ice increased from 2000 to 2020.
0 1 . 3 Using Figure 1, by how much did the extent of sea ice change between
1980 and 2016?
[1 mark]
million km2
Turn over ▶
G/Jun23/8035/1
, 4
Do not write
outside the
box
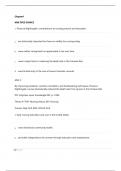
Study Figure 2, a world map showing some possible effects of climate change.
Figure 2
Effects of climate change A temperature rise of 2.5 °C
UN climate scientists warn of specific risks this century could cut global GNI by up
to 2% every year
North America Europe
Asia
Key
Freshwater
shortages Africa
Lower
crop yields
Food Central and
shortages South America
Wildfires Australasia
Health
Small islands
problems
(e.g. Maldives)
Flood damage Oceans
Coastal erosion
(settlements,
natural habitat)
Species loss
GNI = Gross National Income
0 1 . 4 Suggest how climate change may have effects on people.
Use Figure 2 and your own understanding.
[4 marks]
G/Jun23/8035/1
GCSE
GEOGRAPHY
Paper 1 Living with the Physical
Environment
May 2023
, 2
Do not write
outside the
box
For the multiple-choice questions, shade the circle next to the correct answer.
CORRECT METHOD WRONG METHODS
If you want to change your answer you must cross out your original answer as shown.
If you wish to return to an answer previously crossed out, ring the answer you now wish to
select as shown.
Section A The challenge of natural hazards
Answer all questions in this section.
Question 1 The challenge of natural hazards
0 1 . 1 Which one of the following is a natural factor affecting climate change?
Shade one circle only.
[1 mark]
A Agriculture
B Burning fossil fuels
C Deforestation
D Volcanic activity
G/Jun23/8035/1
, 3
Do not write
outside the
box
Study Figure 1, a graph showing average monthly Arctic sea ice extent in
September between 1980 and 2020.
Figure 1
8
7
6
Arctic sea
ice extent
(million km2)
5
4
3
1980 1990 2000 2010 2020
Year
0 1 . 2 Using Figure 1, which one of the following statements is true?
Shade one circle only.
[1 mark]
A The sea ice extent in 1980 and 2000 was the same.
B The sea ice reached its smallest extent in 2012.
C The sea ice decreased every year between 1980 and 1996.
D The sea ice increased from 2000 to 2020.
0 1 . 3 Using Figure 1, by how much did the extent of sea ice change between
1980 and 2016?
[1 mark]
million km2
Turn over ▶
G/Jun23/8035/1
, 4
Do not write
outside the
box
Study Figure 2, a world map showing some possible effects of climate change.
Figure 2
Effects of climate change A temperature rise of 2.5 °C
UN climate scientists warn of specific risks this century could cut global GNI by up
to 2% every year
North America Europe
Asia
Key
Freshwater
shortages Africa
Lower
crop yields
Food Central and
shortages South America
Wildfires Australasia
Health
Small islands
problems
(e.g. Maldives)
Flood damage Oceans
Coastal erosion
(settlements,
natural habitat)
Species loss
GNI = Gross National Income
0 1 . 4 Suggest how climate change may have effects on people.
Use Figure 2 and your own understanding.
[4 marks]
G/Jun23/8035/1