Risk Management Exercises:
TUTORIAL 1:
Exercise 1:
,The thing we have to do is think about what is the risk and expected return
on this portfolio going forward for the year of 2018.
EXCEL:
a) Solution:
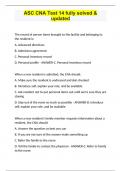
- Portfolio expected return: =MMULT(weights, TRANSPOSE(Exp
return annualized))=4,20%
- Portfolio volatility: =SQRT(MMULT(MMULT(weights, variance
covariance matrix all 3x3 column and rows) ,
TRANSPOSE(weights))) = 8,07%
We can check if this portfolio volatility is correct, just calculate the daily
return of the portfolio and take the standard deviation of that:
=MMULT(weights, TRANSPOSE(of the returns which are one row)) then
when you calculate the one row you just drag down and apply it to every
road. This gives you the returns of the portfolio, and then take the standard
deviation of those returns: =MMULT(STDEV(that column of returns we just
calculated) , SQRT(252))
, Now we are ready to answer the first question of what is the probability that
over the next year, you will lose 10% or more on your portfolio. Discuss
the main assumptions underlying your calculation
To calculate this probability we are going to make 2 assumptions
1. Assume that the distribution of returns (expert expected returns) in
the past is representative of what will happen in the future
2. Assume that return are normally distributed
Mean: Portfolio ER
Standard deviation: Portfolio Volatility
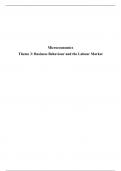
So to calculate this we do: =NORMDIST(-10%, 4,20%, 8,07%, TRUE):
0,039241
b) Calculate your 1%, 5%, and 10% Value-at-Risk at the daily, quarterly,
and yearly frequency in % and in Euro. Interpret your findings.
To calculate your annual value at risk is really simple because we have
already calculated the annual portfolio volatility ao we just need to convert
this to the value at risk.
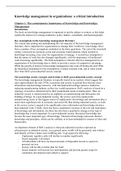
VAR(1%) yearly =-(Expected return +NORMSINV(0,01)*Portfolio Volatility)=
14.57%
vAR (5%)= 9.07%
Var(10%) yearly 6.14%
All this 3 are calculated equally you just need to adjust the NORMSINV)
It decreases as you go scaling because the worst 1% is every time going to
be worst than the worst 10%
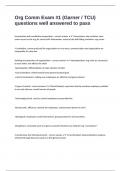
If we want to know the value at risk at different frequencies like for example
at daily frequencies we just need to adjust our estimate of the volatility to
being daily or quarterly
TUTORIAL 1:
Exercise 1:
,The thing we have to do is think about what is the risk and expected return
on this portfolio going forward for the year of 2018.
EXCEL:
a) Solution:
- Portfolio expected return: =MMULT(weights, TRANSPOSE(Exp
return annualized))=4,20%
- Portfolio volatility: =SQRT(MMULT(MMULT(weights, variance
covariance matrix all 3x3 column and rows) ,
TRANSPOSE(weights))) = 8,07%
We can check if this portfolio volatility is correct, just calculate the daily
return of the portfolio and take the standard deviation of that:
=MMULT(weights, TRANSPOSE(of the returns which are one row)) then
when you calculate the one row you just drag down and apply it to every
road. This gives you the returns of the portfolio, and then take the standard
deviation of those returns: =MMULT(STDEV(that column of returns we just
calculated) , SQRT(252))
, Now we are ready to answer the first question of what is the probability that
over the next year, you will lose 10% or more on your portfolio. Discuss
the main assumptions underlying your calculation
To calculate this probability we are going to make 2 assumptions
1. Assume that the distribution of returns (expert expected returns) in
the past is representative of what will happen in the future
2. Assume that return are normally distributed
Mean: Portfolio ER
Standard deviation: Portfolio Volatility
So to calculate this we do: =NORMDIST(-10%, 4,20%, 8,07%, TRUE):
0,039241
b) Calculate your 1%, 5%, and 10% Value-at-Risk at the daily, quarterly,
and yearly frequency in % and in Euro. Interpret your findings.
To calculate your annual value at risk is really simple because we have
already calculated the annual portfolio volatility ao we just need to convert
this to the value at risk.
VAR(1%) yearly =-(Expected return +NORMSINV(0,01)*Portfolio Volatility)=
14.57%
vAR (5%)= 9.07%
Var(10%) yearly 6.14%
All this 3 are calculated equally you just need to adjust the NORMSINV)
It decreases as you go scaling because the worst 1% is every time going to
be worst than the worst 10%
If we want to know the value at risk at different frequencies like for example
at daily frequencies we just need to adjust our estimate of the volatility to
being daily or quarterly