Correlational Research Methods – Lecture
Notes
Lecture 1
Aspects of empirical research
- Samples versus populations
- Descriptives versus inferential statistics
- Levels of measurement (nominal, ordinal, interval, ratio)
- Experimental, quasi-experimental, correlational studies
Samples versus population
Types of sampling design
- Simple random sampling = Every member in the population has an equal chance to be sampled.
- Stratified sampling = The population is divided into strata (e.g., based on gender, age); within each stratum a
random sample is drawn.
- Convenience sampling = Sample of people who are readily available (e.g., people who are present in the
cafeteria, family and friends of the researcher, first year psychology students).
There are many other ways to draw a sample. For the statistical methods we use in this course we (have to) assume
simple random sampling. This might not always be justified.
Descriptive statistics: Summarizing data
Inferential statistics
If we want to make generalizations about the population, descriptive statistics of the sample are not enough.
We use inferential statistics to draw conclusions about the population, based on the information from the sample.
Two popular procedures are:
- Null hypothesis significance testing
- Confidence interval estimation
,Null hypothesis significance testing
1) We formulate the null and alternative hypothesis
2) We make a decision rule
➢ If the p-value < a = Reject the null hypothesis
➢ If the p-value > a = Retain the null hypothesis
3) We obtain the t- and p-value from the output
4) We either reject or keep the null hypothesis and draw conclusions
Measurement levels
Classical measurement levels: Nominal, ordinal, interval, ratio
For this course we distinguish between:
- Categorical variables: Gender, experimental condition, diagnosis, social class
- Quantitative variables: Age, IQ, NEO-PI scores, exam scores etc.
The differences between ordinal and interval levels are not as clear cut as most text books describe them to be.
Research designs
Pearson’s correlation coefficient
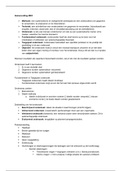
Interpretation of correlational strength
Rules of thumb for the interpretation of correlational strength. Rules of thumb van be a
useful aid, but should be taken with a grain of salt; whether the relationship should be
seen as weak, medium or strong depends on the type of research and the scientific field.
Statistical tests for the correlation coefficient
You have to be able to calculate test statistic t (formula is given), and you
should be able to interpret the results.
P-value
= The probability of the data in the sample (r) or more extreme (further away from 0), given that H0 (p = 0) is true.
Use:
- Decide which significance level to use (usually 5% or a = 0.05)
- When p < a, reject H0
, Lecture 2
Assumptions for r
Independence among observations → Is satisfied when a random sample has been drawn.
- X and Y are linearly related
The relationship between X and Y is best described by drawing a straight line through the scatter plot. There are
no nonlinear relationships between X and Y.
- No extreme bivariate
Non-parametric tests like Spearman’s rho and Kendall’s tau might be used if assumptions are violated.
Bivariate outliers
= A value that is not atypical for the distributions of variables X and Y considered separately, but is atypical for their
bivariate distribution.
Squared Correlation
2
𝑟𝑋𝑌 = 𝑃𝑟𝑜𝑝𝑜𝑟𝑡𝑖𝑜𝑛 𝑜𝑓 𝑣𝑎𝑟𝑖𝑎𝑛𝑐𝑒 𝑖𝑛 𝑋 𝑦𝑜𝑢 𝑐𝑎𝑛 𝑙𝑖𝑛𝑒𝑎𝑟𝑙𝑦 𝑝𝑟𝑒𝑑𝑖𝑐𝑡 𝑓𝑟𝑜𝑚 𝑌 (𝑎𝑛𝑑 𝑣𝑖𝑐𝑒 𝑣𝑒𝑟𝑠𝑎).
Venn Diagrams or Ballentines:
Correlation ≠ Causation
Correlations do not allow for causal interpretation, unless they were retrieved from an experimental study.
Using regression models we can compare different theoretical models.
‘Explanations’ for the relationship between X and Y
Correlation coefficient
The correlation coefficient is a measure that describes the linear relationship between
variables.
- The arrow points both ways.
Simple linear regression analysis
One independent variable X, and one dependent variable Y.
- The arrow points to the dependent variable.
For now, we assume both X and Y are quantitative variables.
The linear simple regression model
Linear relationship between Y and X.
Notes
Lecture 1
Aspects of empirical research
- Samples versus populations
- Descriptives versus inferential statistics
- Levels of measurement (nominal, ordinal, interval, ratio)
- Experimental, quasi-experimental, correlational studies
Samples versus population
Types of sampling design
- Simple random sampling = Every member in the population has an equal chance to be sampled.
- Stratified sampling = The population is divided into strata (e.g., based on gender, age); within each stratum a
random sample is drawn.
- Convenience sampling = Sample of people who are readily available (e.g., people who are present in the
cafeteria, family and friends of the researcher, first year psychology students).
There are many other ways to draw a sample. For the statistical methods we use in this course we (have to) assume
simple random sampling. This might not always be justified.
Descriptive statistics: Summarizing data
Inferential statistics
If we want to make generalizations about the population, descriptive statistics of the sample are not enough.
We use inferential statistics to draw conclusions about the population, based on the information from the sample.
Two popular procedures are:
- Null hypothesis significance testing
- Confidence interval estimation
,Null hypothesis significance testing
1) We formulate the null and alternative hypothesis
2) We make a decision rule
➢ If the p-value < a = Reject the null hypothesis
➢ If the p-value > a = Retain the null hypothesis
3) We obtain the t- and p-value from the output
4) We either reject or keep the null hypothesis and draw conclusions
Measurement levels
Classical measurement levels: Nominal, ordinal, interval, ratio
For this course we distinguish between:
- Categorical variables: Gender, experimental condition, diagnosis, social class
- Quantitative variables: Age, IQ, NEO-PI scores, exam scores etc.
The differences between ordinal and interval levels are not as clear cut as most text books describe them to be.
Research designs
Pearson’s correlation coefficient
Interpretation of correlational strength
Rules of thumb for the interpretation of correlational strength. Rules of thumb van be a
useful aid, but should be taken with a grain of salt; whether the relationship should be
seen as weak, medium or strong depends on the type of research and the scientific field.
Statistical tests for the correlation coefficient
You have to be able to calculate test statistic t (formula is given), and you
should be able to interpret the results.
P-value
= The probability of the data in the sample (r) or more extreme (further away from 0), given that H0 (p = 0) is true.
Use:
- Decide which significance level to use (usually 5% or a = 0.05)
- When p < a, reject H0
, Lecture 2
Assumptions for r
Independence among observations → Is satisfied when a random sample has been drawn.
- X and Y are linearly related
The relationship between X and Y is best described by drawing a straight line through the scatter plot. There are
no nonlinear relationships between X and Y.
- No extreme bivariate
Non-parametric tests like Spearman’s rho and Kendall’s tau might be used if assumptions are violated.
Bivariate outliers
= A value that is not atypical for the distributions of variables X and Y considered separately, but is atypical for their
bivariate distribution.
Squared Correlation
2
𝑟𝑋𝑌 = 𝑃𝑟𝑜𝑝𝑜𝑟𝑡𝑖𝑜𝑛 𝑜𝑓 𝑣𝑎𝑟𝑖𝑎𝑛𝑐𝑒 𝑖𝑛 𝑋 𝑦𝑜𝑢 𝑐𝑎𝑛 𝑙𝑖𝑛𝑒𝑎𝑟𝑙𝑦 𝑝𝑟𝑒𝑑𝑖𝑐𝑡 𝑓𝑟𝑜𝑚 𝑌 (𝑎𝑛𝑑 𝑣𝑖𝑐𝑒 𝑣𝑒𝑟𝑠𝑎).
Venn Diagrams or Ballentines:
Correlation ≠ Causation
Correlations do not allow for causal interpretation, unless they were retrieved from an experimental study.
Using regression models we can compare different theoretical models.
‘Explanations’ for the relationship between X and Y
Correlation coefficient
The correlation coefficient is a measure that describes the linear relationship between
variables.
- The arrow points both ways.
Simple linear regression analysis
One independent variable X, and one dependent variable Y.
- The arrow points to the dependent variable.
For now, we assume both X and Y are quantitative variables.
The linear simple regression model
Linear relationship between Y and X.