Earthquakes 1 – Recording Station GIZMO < ALL ANSWERS CORRECT>
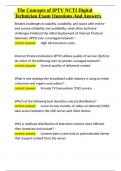
Earthquakes 1 – Recording Station GIZMO < ALL ANSWERS CORRECT> Name: Date: Earthquakes GIZMO Vocabulary: body wave, earthquake, epicenter, fault, focus, P-wave, S-wave, seismic wave, seismogram, seismograph Prior Knowledge Questions (Do these BEFORE using the Gizmo.) Gizmo Warm-up The Earthquakes 1 – Recording Station Gizmo simulates the seismic waves released by an earthquake. To begin, look at the key on the bottom left side of the Gizmo. 1. The epicenter of the earthquake is the point on Earth’s surface closest to the focus, or origin, of the earthquake. A. What symbol represents the epicenter? B. What symbol represents the recording station? 2. Click Play ( ) and observe the seismic waves leaving the epicenter of the earthquake. A. What types of seismic waves are released? B. Look at the Recording station detector on the upper left side of the Gizmo. What happens when the seismic waves hit the recording station? Activity A: Reading a seismogram Get the Gizmo ready: • Click Reset ( ). • Check that the Distance from the station to the center of earthquake is 860 km. Introduction: An earthquake releases an enormous amount of energy, which passes through Earth’s interior in the form of body waves. There are two types of body waves: P-waves (primary waves) and S-waves (secondary waves). Scientists study earthquakes with the aid of an instrument called a seismograph. When seismic waves reach the seismograph, a graphical record, or seismogram, is produced. Question: How are P- and S-waves shown on a seismogram? 1. Observe: Click Play, and then click Pause ( ) after the purple P-wave hits the station. A. Look at the upper right corner of the seismogram. At what time did the P-wave hit? B. What is shown on the seismogram at this time? 2. Observe: Click Play, and then click Pause after the green S-wave hits the station. A. At what time did the S-wave hit? B. What is shown on the seismogram at this time? 3. Describe: Click Play and wait for the vibrations to stop. Suppose you were at the recording station when the earthquake hit. Based on the pattern of waves on the seismogram, what did you experience during the earthquake? 4. Explore: Click Reset, and drag the recording station closer to the epicenter. Click Play. A. How does this seismogram differ from the one you first investigated? B. What would this earthquake feel like? Activity B: Distance to the epicenter Get the Gizmo ready: • Click Reset. • Place the recording station 300 km from the epicenter. (Does not have to be exact.) Question: How can you determine how far you are from the center of an earthquake? 1. Observe: Click Play, and observe the P- and S-waves. Which waves are faster? 2. Measure: Wait until the seismogram is complete. Turn on Show time probe. Place the left (green) probe on the first P-wave, and the right (blue) probe on the first S-wave. (See example at right.) What is the Time difference (∆t) between the P- and S-waves? 3. Predict: How do you think the time difference between the first P-wave and the first S-wave will change as the distance to the epicenter increases? 4. Gather data: Place the recording station at each of the following distances to the epicenter. (Does not need to be exact.) Measure the P- and S-wave time difference (∆t) on the seismogram at each distance, and record the values in the table on the left. 5. Make a graph: Plot your data on the graph to the right of the data table. Draw a line to connect the points in order. What does this graph show? (Activity B continued on next page) Activity B (continued from previous page) 6. Draw conclusions: How does the time difference (∆t) between the first P-wave and the first S-wave relate to the distance to the epicenter? 7. Apply: Suppose a recording station was located 500 km from the epicenter. What will be the time difference (∆t) between the first P-wave and the first S-wave? Check your answer using the Gizmo. Were you correct? 8. Practice: On each of the seismograms below, label the first P-wave and the first S-wave. Estimate the time difference (∆t), and then use your graph to find the distance to the epicenter. (As in the Gizmo, each vertical line represents 50 seconds.) ∆t: Distance: ∆t: Distance: ∆t: Distance: Part 2: Three dogs meet in a park. Each dog is attached by a leash to its owner (triangles).
Escuela, estudio y materia
- Institución
- 123 University
- Grado
- Earthquakes 1 – Recording Station GIZMO
Información del documento
- Subido en
- 7 de diciembre de 2023
- Número de páginas
- 11
- Escrito en
- 2023/2024
- Tipo
- Examen
- Contiene
- Preguntas y respuestas
Temas
-
earthquakes 1 recording station gizmo al