Table of contents
General introduction ............................................................................................................................... 2
Chapter 6: ANOVA ................................................................................................................................... 4
Chapter 7: Bivariate Pearson Correlation................................................................................................ 8
Chapter 9: Bivariate regression ............................................................................................................. 13
Chapter 10: Adding a third variable ...................................................................................................... 18
Chapter 11: Multiple regression – 2 predictors .................................................................................... 23
Chapter 12: Dummy predictor variables ............................................................................................... 28
Chapter 14: Multiple regression............................................................................................................ 30
Chapter 15: Moderation ........................................................................................................................ 34
Chapter 16 (and 11.9/11.10): Path analysis .......................................................................................... 39
Chapter 23: Logistic regression ............................................................................................................. 46
Part one ............................................................................................................................................. 46
Part two ............................................................................................................................................. 51
1
,General introduction
If you want to measure the degree of association between variables, you should use descriptive
research questions.
If you want to know why a certain variable as a positive effect on another, you should use
explanatory research questions.
Causal analysis techniques
• Are important because they answer what and why research questions
• They have in common: estimate how much the variance in a dependent variable (y)
systematically varies with the variance in other measured explanatory variables (x)
Scores on dependent variables can be predicted by:
▪ X variables that are measured and included as predictors that systematically affect Y.
▪ Variables that we have not measured and not included as predictors, but that
systematically affect Y (ε = systematic error (or residual))
▪ Variables that we have not measured and that only randomly affect Y (ε = random
error (or residual))
• They are distinguished by:
▪ measurement levels of Y
▪ measurement levels of X
▪ the number of variables the technique can deal with
Methods to analyse the type of associations
1. One-Way Between Subjects Analysis of Variance (ANOVA)
X (nominal/categorical) > Y (continues scale)
They give the same results
2. Bivariate regression analysis
X>Y
3. Multiple regression analysis
Includes multiple independent variables and different measurement levels can be used
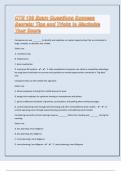
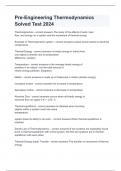
r = correlation
Gender
= interaction effect (moderation)
r
Salary Organizational commitment (OC)
r
Team in which someone works
2
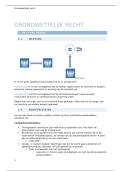
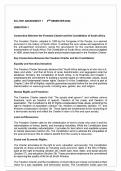
, 4. Path analysis
Multiple independent variables and dependent variables
Gender
r Salary Organizational commitment
Team in which someone works
5. Bivariate binary logistic regression analysis
The dependent variable has only two outcomes; either it occurs or it doesn’t occur.
X (nominal)> Y (yes/no)
e.g. team in which someone works > becoming unemployed ( 0 = no & 1 = yes)
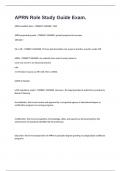
6. Multiple binary logistic regression analysis
Gender
Salary Becoming unemployed
Team in which someone works
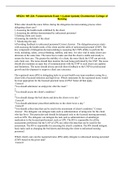
Overview
Independent variable Dependent variable
Quantitative (continuous) Qualitative (nominal)
Smaller number (1 or 2) qualitative ANOVA Table analysis or long linear
analysis = not in exam
Every number qualitative and/or Bivariate/multiple regression Bivariate/multiple logistic
quantitative analysis and path analysis regression analysis
3
, Chapter 6: ANOVA
Logic of AONVA
Team in which someone works (x) > organizational commitment (y)
Substantive hypothesis
A person’s degree of organizational commitment (y) depends on the team in which he/she works (x)
Fundamental principle of ANOVA
Analyses the ratio of the two components of total variance in data: between-group variance and
within-group variance
Information on variance of average scores between groups
Information on variance of scores within groups
Between-group variance measures systematic differences between groups and all other variances
that influences Y, either systematically or randomly (‘residual variance’ or ‘error’)
Within-group differences measures influence of all other variables that influence Y either
systematically or randomly (‘residual variance’ or ‘error’)
There is more systematic difference when differences within a team are small (more coherent).
Consequently, differences between teams are more clear.
Important to realize
Any difference within a group cannot be due to differences between the groups because everyone in
a particular group has the same group score; so, within-group differences must be due to systematic
unmeasured factors (e.g. individual differences like gender) or random measurement error.
Any observed differences between groups are probably not only pure between-group differences,
but also differences due to systematic unmeasured factors or random measurement error.
So, basically, we are comparing between-group variability to within-group variability to learn about
the size of the systematic group effect.
Statistical 0 hypothesis
Mean scores of populations (k) corresponding to the groups in the study are all equal to each other >
H0: µ1 = µ2 = … = µk OR all things are equal (=) to 0
Alternative hypothesis
Not all groups are different from each other, but there are two groups different and possibly more.
Why prefer ANOVA instead of separate t-tests for means?
One will make the mistake of concluding that there is an effect, while there is not (Type I error)
4
General introduction ............................................................................................................................... 2
Chapter 6: ANOVA ................................................................................................................................... 4
Chapter 7: Bivariate Pearson Correlation................................................................................................ 8
Chapter 9: Bivariate regression ............................................................................................................. 13
Chapter 10: Adding a third variable ...................................................................................................... 18
Chapter 11: Multiple regression – 2 predictors .................................................................................... 23
Chapter 12: Dummy predictor variables ............................................................................................... 28
Chapter 14: Multiple regression............................................................................................................ 30
Chapter 15: Moderation ........................................................................................................................ 34
Chapter 16 (and 11.9/11.10): Path analysis .......................................................................................... 39
Chapter 23: Logistic regression ............................................................................................................. 46
Part one ............................................................................................................................................. 46
Part two ............................................................................................................................................. 51
1
,General introduction
If you want to measure the degree of association between variables, you should use descriptive
research questions.
If you want to know why a certain variable as a positive effect on another, you should use
explanatory research questions.
Causal analysis techniques
• Are important because they answer what and why research questions
• They have in common: estimate how much the variance in a dependent variable (y)
systematically varies with the variance in other measured explanatory variables (x)
Scores on dependent variables can be predicted by:
▪ X variables that are measured and included as predictors that systematically affect Y.
▪ Variables that we have not measured and not included as predictors, but that
systematically affect Y (ε = systematic error (or residual))
▪ Variables that we have not measured and that only randomly affect Y (ε = random
error (or residual))
• They are distinguished by:
▪ measurement levels of Y
▪ measurement levels of X
▪ the number of variables the technique can deal with
Methods to analyse the type of associations
1. One-Way Between Subjects Analysis of Variance (ANOVA)
X (nominal/categorical) > Y (continues scale)
They give the same results
2. Bivariate regression analysis
X>Y
3. Multiple regression analysis
Includes multiple independent variables and different measurement levels can be used
r = correlation
Gender
= interaction effect (moderation)
r
Salary Organizational commitment (OC)
r
Team in which someone works
2
, 4. Path analysis
Multiple independent variables and dependent variables
Gender
r Salary Organizational commitment
Team in which someone works
5. Bivariate binary logistic regression analysis
The dependent variable has only two outcomes; either it occurs or it doesn’t occur.
X (nominal)> Y (yes/no)
e.g. team in which someone works > becoming unemployed ( 0 = no & 1 = yes)
6. Multiple binary logistic regression analysis
Gender
Salary Becoming unemployed
Team in which someone works
Overview
Independent variable Dependent variable
Quantitative (continuous) Qualitative (nominal)
Smaller number (1 or 2) qualitative ANOVA Table analysis or long linear
analysis = not in exam
Every number qualitative and/or Bivariate/multiple regression Bivariate/multiple logistic
quantitative analysis and path analysis regression analysis
3
, Chapter 6: ANOVA
Logic of AONVA
Team in which someone works (x) > organizational commitment (y)
Substantive hypothesis
A person’s degree of organizational commitment (y) depends on the team in which he/she works (x)
Fundamental principle of ANOVA
Analyses the ratio of the two components of total variance in data: between-group variance and
within-group variance
Information on variance of average scores between groups
Information on variance of scores within groups
Between-group variance measures systematic differences between groups and all other variances
that influences Y, either systematically or randomly (‘residual variance’ or ‘error’)
Within-group differences measures influence of all other variables that influence Y either
systematically or randomly (‘residual variance’ or ‘error’)
There is more systematic difference when differences within a team are small (more coherent).
Consequently, differences between teams are more clear.
Important to realize
Any difference within a group cannot be due to differences between the groups because everyone in
a particular group has the same group score; so, within-group differences must be due to systematic
unmeasured factors (e.g. individual differences like gender) or random measurement error.
Any observed differences between groups are probably not only pure between-group differences,
but also differences due to systematic unmeasured factors or random measurement error.
So, basically, we are comparing between-group variability to within-group variability to learn about
the size of the systematic group effect.
Statistical 0 hypothesis
Mean scores of populations (k) corresponding to the groups in the study are all equal to each other >
H0: µ1 = µ2 = … = µk OR all things are equal (=) to 0
Alternative hypothesis
Not all groups are different from each other, but there are two groups different and possibly more.
Why prefer ANOVA instead of separate t-tests for means?
One will make the mistake of concluding that there is an effect, while there is not (Type I error)
4