Inferential statistics: subtest 2 (550, 553, 554, 560, 561, 563, 510, 545, 548, 590)
Vy Nguyen
Unit 550: Multiple regression addition: the effect of two variables
Key terms:
◼ Multiple regression
◼ Addition
◼ (Analysis of) residuals
- Build up and assess a multiple regression model with the additive effect of variables using R
When doing empirical research, and when analysing the data, you first think about …
• Units and variables in the study (individuals, 3 variables)
• Measurement level of variables (dich & two scales, scale range (0-7) and (0-10))
• Causally related variables (direction in the arrows)
• The research design used (correlational)
• Inference or only descriptive
When analysing data, always check
1. Independent cases condition: is it a really random sample from a population and not for
example selecting people from the same municipality or family members.
2. Random selection of cases
3. (10% condition): if the population is not huge and you select more than 10% you cannot use
inferential statistics
4. ‘Even distribution’ condition (NNC); not skewed or bimodal
DESCRIBING AND TESTING: addition elaboration model (=TV has its own relation with Y,
independent from X. TV is another independent variable (X2))
LINEAR EQUATIONS: EFFECT OF A RATIO VARIABLE AND A DUMMY ON A RATIO
VARIABLE: the relationship between a dependent scale variable and two independent variables: a
dummy and ratio variable
Example: emotional intelligence (dependent scale variable) is affected by both the level of education
(independent ratio variable) and the type of family you were brought up in (independent dummy
variable). If it is an open family type, your emotional intelligence will probably be bigger or higher if
it had been close.
Hypothetical graph (based on thinking, not data): the level of education increases, your EQ also gets
bigger. In addition, if you are raised in a family type 1 (open), then also your emotional intelligence
will be bigger.
This model is ADDITION, we think that both education and the family independently affect you EQ
intelligence (both variables independently affect the dependent variable)
Combining the effect of education and type of family on EQ in one linear equation: addition
Example: the dependent variable (Y) is affected by first a constant. So, we have some level of EQ and
then if you’re brought up in a family type, that is affecting that EQ level and if you have a high level
of education, your IQ level increases.
̂ = β0 + β2 ∗ Type + β1 Education
Y
1
, Inferential statistics: subtest 2 (550, 553, 554, 560, 561, 563, 510, 545, 548, 590)
Vy Nguyen
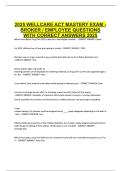
Type is either 0 (closed) or 1 (open) (a dummy). This simplifies to:
- The effect of education for both groups is the same (β1 ), that why we have the two parallel
lines.
- β0 is the intercept when the family type is also 0. So, education is 0 and family type is 0
- β2 is the additional effect if you are raised in a family type of 1 (open type of family)
A deterministic relationship is NOT expected
In addition to type of family and education we expect some error. That error can be seen in the
deviations from the lines that we expect. We think that other factors together also have an influence on
the EQ level. We assume that this error term is normally distributed, because we think that all the
factors that are affecting EQ level together have a random effect on the EQ level. We also expect this
error to be the same across all groups.
Y = β0 + β2 ∗ Type + β1 Education + 𝜖
We assume (and have to check later) that 𝜖 is normally distributed (errors do not differ across (groups
of) cases)
So, that means that you always need to check whether the residuals (= an estimate of the true error in
the population) are normal and equal across these lines and between the groups. If they are not, we
need to adjust the way we estimate the relationships.
Not like this! The errors on one side are much bigger, or in the middle, are much bigger than on the
outside of the line or different between the different groups.
In multiple regression, two types of expectations
General expectation: we test whether the Specific expectation(s): whether the two
model as a whole is having some effect variables, have or do not have an effect
H0 : β2 = β1 = 0 (variables have no effect) H0 : β… = 0 (variable has no effect)
HA : at least one β′ is not zero HA : β… ≠ 0 (variable has an effect
Conclusions
2
, Inferential statistics: subtest 2 (550, 553, 554, 560, 561, 563, 510, 545, 548, 590)
Vy Nguyen
The level of education is not having an effect while family is having an effect. It may be that the
overall model gives us a reason to believe that we are on the right track. We understand a bit of the
world. If we look more closely at a more specific expectation. We see that it is basically only family
type that is explaining differences in emotional intelligence.
LINEAR EQUATIONS: EFFECT OF A TWO RATIO VARIABLES ON A RATIO
VARIABLE: the relationship between a dependent scale variable and two independent variables: two
ratio variables
Example: the relationship between age (ratio variable) and education (ratio variable), both are
expected to have a negative effect on ‘other-directed ageism’.
Combining the effect of education and age on ageism in one linear equation: addition
We add the effect of two variables to understand the dependent variable. We can say we focus mainly
on age (main effect) and then we look in addition at differences in education, and we take the level of
education to be values of 0, 1, 2 … (plusses although the beta coefficients are now negative)
̂ = β0 + β1 ∗ Age + β2 Education
Y
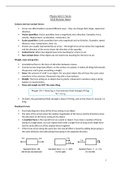
The effect of age is the same for all the education groups, meaning that all the lines are parallel (all the
lines for different levels of education). The differences in education are then shown by say differences
in the intercepts that are associated with these education levels.
- So, the first half is now referring to many educations, difference in the intercept (𝛽2 ) and;
- All the 𝛽1 refer to the effect of age and all these effects are the same for all groups because we
assume that both variables only in an additional way explain the level of ageism.
- Intercept 𝛽0 : the level of ‘ageism’ if both age and education are zero: since education can be
one, two, three etc. these intercepts for these more specific lines become a bit smaller.
Since both have a negative effect if age increases the level of agism decreases, generally. If the level
of education goes up, the level of ageism goes down meaning that parallel lines are associated with
education 0, 1, 2 etc.
But, we now simply use:
̂ = 𝛃𝟎 + 𝛃𝟏 ∗ 𝐀𝐠𝐞 + 𝛃𝟐 𝐄𝐝𝐮𝐜𝐚𝐭𝐢𝐨𝐧
𝐘
Checking ‘residuals’
We have to check the residuals in this context, but it becomes less easy. It is very difficult to inspect it
using visual inspection. So, we need to check the normality and the equal variance idea of the
residuals, but we can’t simply do that by having a look at the graph. This because all the dots are quite
3
, Inferential statistics: subtest 2 (550, 553, 554, 560, 561, 563, 510, 545, 548, 590)
Vy Nguyen
close to each other. That’s why you need to learn to study the residuals by saving them and then
posting them against the X variables and against the predicted value.
- Normality
- Equal variance of the residuals
In multiple regression, two types of expectations
General expectation: Specific expectations:
H0 : β2 = β1 = 0 (variables have no effect) H0 : β… = 0 (variable has no effect)
HA : at least one β′ is not zero HA : β… ≠ 0 (variable has an effect)
Conclusion
Adding two ratio variable is ‘merely’ an extension of the model, but we need to check many things
now.
CHECKING RESIDUALS
In a bivariate context, residuals are just the deviation between the estimated line and the observed
point. It is important to note we take these residuals as an estimate of what is going on in the
population. This means, if we do not exactly see a normal distribution or small groups of data points
that deviates from the line, that is not necessary problematic, because that may be an outcome of the
random sampling process. Small deviations are therefore not necessary problematic.
NOTE: although we focus on the residuals in the SAMPLE we are interested in the residuals in the
POPULATION.
In a multivariate context, it is basically the same thing…
Y is explained by both x2 and gender. Suppose that red refers to man and the red line also refers to
man. Then the deviation (the difference) between the line and that red data point is the residual. But it
is less obvious to inspect using a scatterplot. So, therefor we need other instruments to check the
residuals.
What should residuals look like?
Residuals should be ‘normal’ (distribution) and ‘equal’
4
Vy Nguyen
Unit 550: Multiple regression addition: the effect of two variables
Key terms:
◼ Multiple regression
◼ Addition
◼ (Analysis of) residuals
- Build up and assess a multiple regression model with the additive effect of variables using R
When doing empirical research, and when analysing the data, you first think about …
• Units and variables in the study (individuals, 3 variables)
• Measurement level of variables (dich & two scales, scale range (0-7) and (0-10))
• Causally related variables (direction in the arrows)
• The research design used (correlational)
• Inference or only descriptive
When analysing data, always check
1. Independent cases condition: is it a really random sample from a population and not for
example selecting people from the same municipality or family members.
2. Random selection of cases
3. (10% condition): if the population is not huge and you select more than 10% you cannot use
inferential statistics
4. ‘Even distribution’ condition (NNC); not skewed or bimodal
DESCRIBING AND TESTING: addition elaboration model (=TV has its own relation with Y,
independent from X. TV is another independent variable (X2))
LINEAR EQUATIONS: EFFECT OF A RATIO VARIABLE AND A DUMMY ON A RATIO
VARIABLE: the relationship between a dependent scale variable and two independent variables: a
dummy and ratio variable
Example: emotional intelligence (dependent scale variable) is affected by both the level of education
(independent ratio variable) and the type of family you were brought up in (independent dummy
variable). If it is an open family type, your emotional intelligence will probably be bigger or higher if
it had been close.
Hypothetical graph (based on thinking, not data): the level of education increases, your EQ also gets
bigger. In addition, if you are raised in a family type 1 (open), then also your emotional intelligence
will be bigger.
This model is ADDITION, we think that both education and the family independently affect you EQ
intelligence (both variables independently affect the dependent variable)
Combining the effect of education and type of family on EQ in one linear equation: addition
Example: the dependent variable (Y) is affected by first a constant. So, we have some level of EQ and
then if you’re brought up in a family type, that is affecting that EQ level and if you have a high level
of education, your IQ level increases.
̂ = β0 + β2 ∗ Type + β1 Education
Y
1
, Inferential statistics: subtest 2 (550, 553, 554, 560, 561, 563, 510, 545, 548, 590)
Vy Nguyen
Type is either 0 (closed) or 1 (open) (a dummy). This simplifies to:
- The effect of education for both groups is the same (β1 ), that why we have the two parallel
lines.
- β0 is the intercept when the family type is also 0. So, education is 0 and family type is 0
- β2 is the additional effect if you are raised in a family type of 1 (open type of family)
A deterministic relationship is NOT expected
In addition to type of family and education we expect some error. That error can be seen in the
deviations from the lines that we expect. We think that other factors together also have an influence on
the EQ level. We assume that this error term is normally distributed, because we think that all the
factors that are affecting EQ level together have a random effect on the EQ level. We also expect this
error to be the same across all groups.
Y = β0 + β2 ∗ Type + β1 Education + 𝜖
We assume (and have to check later) that 𝜖 is normally distributed (errors do not differ across (groups
of) cases)
So, that means that you always need to check whether the residuals (= an estimate of the true error in
the population) are normal and equal across these lines and between the groups. If they are not, we
need to adjust the way we estimate the relationships.
Not like this! The errors on one side are much bigger, or in the middle, are much bigger than on the
outside of the line or different between the different groups.
In multiple regression, two types of expectations
General expectation: we test whether the Specific expectation(s): whether the two
model as a whole is having some effect variables, have or do not have an effect
H0 : β2 = β1 = 0 (variables have no effect) H0 : β… = 0 (variable has no effect)
HA : at least one β′ is not zero HA : β… ≠ 0 (variable has an effect
Conclusions
2
, Inferential statistics: subtest 2 (550, 553, 554, 560, 561, 563, 510, 545, 548, 590)
Vy Nguyen
The level of education is not having an effect while family is having an effect. It may be that the
overall model gives us a reason to believe that we are on the right track. We understand a bit of the
world. If we look more closely at a more specific expectation. We see that it is basically only family
type that is explaining differences in emotional intelligence.
LINEAR EQUATIONS: EFFECT OF A TWO RATIO VARIABLES ON A RATIO
VARIABLE: the relationship between a dependent scale variable and two independent variables: two
ratio variables
Example: the relationship between age (ratio variable) and education (ratio variable), both are
expected to have a negative effect on ‘other-directed ageism’.
Combining the effect of education and age on ageism in one linear equation: addition
We add the effect of two variables to understand the dependent variable. We can say we focus mainly
on age (main effect) and then we look in addition at differences in education, and we take the level of
education to be values of 0, 1, 2 … (plusses although the beta coefficients are now negative)
̂ = β0 + β1 ∗ Age + β2 Education
Y
The effect of age is the same for all the education groups, meaning that all the lines are parallel (all the
lines for different levels of education). The differences in education are then shown by say differences
in the intercepts that are associated with these education levels.
- So, the first half is now referring to many educations, difference in the intercept (𝛽2 ) and;
- All the 𝛽1 refer to the effect of age and all these effects are the same for all groups because we
assume that both variables only in an additional way explain the level of ageism.
- Intercept 𝛽0 : the level of ‘ageism’ if both age and education are zero: since education can be
one, two, three etc. these intercepts for these more specific lines become a bit smaller.
Since both have a negative effect if age increases the level of agism decreases, generally. If the level
of education goes up, the level of ageism goes down meaning that parallel lines are associated with
education 0, 1, 2 etc.
But, we now simply use:
̂ = 𝛃𝟎 + 𝛃𝟏 ∗ 𝐀𝐠𝐞 + 𝛃𝟐 𝐄𝐝𝐮𝐜𝐚𝐭𝐢𝐨𝐧
𝐘
Checking ‘residuals’
We have to check the residuals in this context, but it becomes less easy. It is very difficult to inspect it
using visual inspection. So, we need to check the normality and the equal variance idea of the
residuals, but we can’t simply do that by having a look at the graph. This because all the dots are quite
3
, Inferential statistics: subtest 2 (550, 553, 554, 560, 561, 563, 510, 545, 548, 590)
Vy Nguyen
close to each other. That’s why you need to learn to study the residuals by saving them and then
posting them against the X variables and against the predicted value.
- Normality
- Equal variance of the residuals
In multiple regression, two types of expectations
General expectation: Specific expectations:
H0 : β2 = β1 = 0 (variables have no effect) H0 : β… = 0 (variable has no effect)
HA : at least one β′ is not zero HA : β… ≠ 0 (variable has an effect)
Conclusion
Adding two ratio variable is ‘merely’ an extension of the model, but we need to check many things
now.
CHECKING RESIDUALS
In a bivariate context, residuals are just the deviation between the estimated line and the observed
point. It is important to note we take these residuals as an estimate of what is going on in the
population. This means, if we do not exactly see a normal distribution or small groups of data points
that deviates from the line, that is not necessary problematic, because that may be an outcome of the
random sampling process. Small deviations are therefore not necessary problematic.
NOTE: although we focus on the residuals in the SAMPLE we are interested in the residuals in the
POPULATION.
In a multivariate context, it is basically the same thing…
Y is explained by both x2 and gender. Suppose that red refers to man and the red line also refers to
man. Then the deviation (the difference) between the line and that red data point is the residual. But it
is less obvious to inspect using a scatterplot. So, therefor we need other instruments to check the
residuals.
What should residuals look like?
Residuals should be ‘normal’ (distribution) and ‘equal’
4