Causal Analysis Techniques for Pre-master Students
Lecturer: John Gelissen
Central topic in this course: Why is there variation in the dependent variable(s) in a study? Why do
scores on our variable of interest differ between cases… and can we explain (a part) of that
difference?
In this course, we deal with the following statistical techniques:
Lecture 1: One-Way Between-Subjects Analysis of Variance (Chapter 6.1 tm 6.9 of
Warner/Gelissen) ................................................................................................................................ 4
Lecture 2: Bivariate Pearson Correlation (Chapter 7 of Warner/Gelissen) ....................................... 17
Lecture 3: Bivariate Regression (Chapter 9 of Warner/Gelissen) ..................................................... 29
Lecture 4: The logic of elaboration (Chapter 10 of Warner/Gelissen) .............................................. 41
Lecture 5: Multiple regression (Chapter 11 of Warner/Gelissen) ..................................................... 49
Lecture 6: Dummy predictor variables (Chapter 12 of Warner/Gelissen) ........................................ 58
Lecture 7: Multiple Regression (Chapter 14 of Warner/Gelissen) .................................................... 63
Lecture 8: Moderation (Chapter 15 of Warner/Gelissen) ................................................................. 70
Lecture 9: Path analysis (Chapter 11.9, 11.10, & 15 of Warner/Gelissen)........................................ 79
Lecture 10: Path analysis 2 (Chapter 11.9, 11.10, & 15 of Warner/Gelissen) ................................... 83
Lecture 11: Logistic regression (Chapter 16 of Warner/Gelissen) .................................................... 90
Lecture 12: Logistic regression 2 (Chapter 16 of Warner/Gelissen) ................................................. 99
Lecture 13: Example of logistic regression analysis (Chapter 16 of Warner/Gelissen) ................... 106
Lecture 14: Practice exam & SPSS test & Composition of final exam ............................................. 114
Why do you choose one or the other?
− Measurement level of the dependent variable(s) Y Are they mainly:
Categorical/nominal VS interval/ratio
− Measurement level of the independent variable(s) X
Categorical/nominal VS interval/ratio
− Complexity of theory: number of variables and relations and type of
relations
Overview of all Appendix:
Appendix A, pages: 686ʹ689 Proportions of Area Under a Standard Normal Curve
Appendix B, pages: 690 Critical Values for t Distribution
Appendix C, pages: 691ʹ693 Critical Values of F
Appendix D, pages: 694 Critical Values of Chi-Square
Appendix E, pages: 695 Critical Values of the Pearson Correlation Coefficient
1
,Which techniques will you learn, and why?
1. They are important because they help us to answer what and why research questions
2. They have in common: estimate how much the variance in a dependent variable Y
systematically varies with (‘co-varies’) the variance in other measured explanatory variable(s)
X; techniques assume that scores on dependent variable Y can be predicted by
a) X variables that we have measured and included as predictors that systematically affect
the dependent variable
b) variables that we have not measured and not included as predictors, but that
systematically affect the dependent variable ( ε → systematic error/residual)
c) variables that we have not measured and that only randomly affect the dependent
variable (also ε → random error/residual)
3. They are distinguished by:
(a) measurement levels of dependent variables (nominal, ordinal, interval, ratio)
(b) the measurement level of the explanatory variables/independent variables
(c) the number of variables the technique can deal with (complexity of the theory)
Complexity of associations
One-way Between-Subjects Analysis of Variance (ANOVA):
Important remark: we use the concepts ‘X variables’, ‘independent variables’, ‘explanatory variables’,
‘predictors’ interchangeably
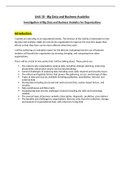
Bivariate regression analysis:
Multiple regression analysis:
→ you have only one dependent var
iable (Y)
Path analysis:
Y
→ Only difference between 2 above: multiple dependent variables. Not only Y as dependent
variable, but also salary! = Extension of multiple regression analysis. Look at the arrows to identify
2
,the directions and dependent/independent variables.
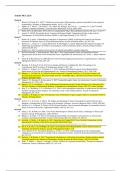
Bivariate binary logistic regression analysis
→ Here the dependent variable has 2 categories/outcomes. For example becoming unemployed yes
or no. So, use when one or more predictor variables and a binary/dichotomous dependent variable
(only 2 answer categories) generally coded as 0 and 1.
Multiple binary logistic regression analysis
→ Here the dependent variable has 2 categories/outcomes. For example becoming unemployed yes
or no. So, use when one or more predictor variables and a binary/dichotomous dependent variable
(only 2 answer categories) generally coded as 0 and 1.
Why are these techniques important?
They are important because they help us to answer what and why RQs:
• What: usually descriptive RQ. E.g. the correlation between the level of education of parents
and the income of a child → to answer this; estimate the correlation coefficient between
these two variables.
• Why: becomes important when you learn techniques to answer the explanatory RQ.
! The measurement level of the DV determined to a very large extent which systematic method you
use. Measurement levels: nominal, ordinal, scale ʹ interval (no zero-point) and ratio (incl. zero-point)
(They must be all:
− Mutually exclusive (= categories can’t overlap)
− Exhaustive (= everyone should be able to find an answer within the categories).
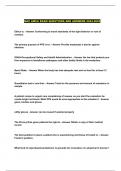
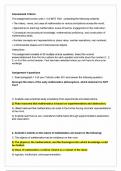
Summary table: Few variables for ANOVA: not complex. Pearson’s r is not in this table (partial
correlation and multiple regression are based on Pearson’s r)
Dependent variable (Y)
Quantitative Qualitative
(Continuous: Interval/Ratio) (Nominal)
Independent Variables (X)
ANOVA (One-Way Between Table-analysis or Log-linear
Small number (1 or 2) Subjects Analysis of Variance) analysis
Qualitative (Few categorical X, one Y) (not part of this course)
Every number Bivariate Regression analysis Logistic Regression
Qualitative (one X, one Y) (Bivariate or Multiple)
and/or Multiple Regression analysis
Quantitative (many X, one Y)
Path Analysis
(mixing X and Y)
3
, → You can only calculate on average with a continuous variable
→ The difference is the measurement level
Lecture 1: One-Way Between-Subjects Analysis of Variance (Chapter 6.1 tm 6.9 of
Warner/Gelissen)
Logic of ANOVA
Substantive hypothesis (H1): A person’s degree of organizational commitment (Y) depends on the
team in which the person works (X)
− Question: if the hypothesis is correct, what would you expect to find with regard to
differences in average commitment between the teams?
− Imagine that we have collected data of measurements of organizational commitment for 3
teams
− 2 scenarios with regard to the data...
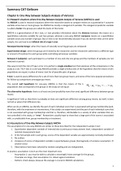
Fundamental principle of ANOVA:
ANOVA is a statistical analysis that tests whether there are statistically significant differences
between group means on scores on a quantitative outcome variable across two or more groups.
The test statistic, an F ratio, compares the magnitude of differences among group means (as indexed
by MSbetween) with the amount of variability of scores within groups that arises due to the influence of
error variables (indexed by MSwithin)
We see in scenario 2 that there is less variance within the team, therefore we see more clearly the
differences between the teams. We do have the same means; it is the variance that makes the
difference.
In which of the data scenarios would you be more inclined to conclude that there is a connection
between the team in which someone works and organizational commitment?
The second one! Why? Key idea of ANOVA/variance analysis is: When there are 2 or more groups,
can we make a statement about possible -significant- differences between the mean scores of the
groups? So we want small within group differences and big between group differences!
4
Lecturer: John Gelissen
Central topic in this course: Why is there variation in the dependent variable(s) in a study? Why do
scores on our variable of interest differ between cases… and can we explain (a part) of that
difference?
In this course, we deal with the following statistical techniques:
Lecture 1: One-Way Between-Subjects Analysis of Variance (Chapter 6.1 tm 6.9 of
Warner/Gelissen) ................................................................................................................................ 4
Lecture 2: Bivariate Pearson Correlation (Chapter 7 of Warner/Gelissen) ....................................... 17
Lecture 3: Bivariate Regression (Chapter 9 of Warner/Gelissen) ..................................................... 29
Lecture 4: The logic of elaboration (Chapter 10 of Warner/Gelissen) .............................................. 41
Lecture 5: Multiple regression (Chapter 11 of Warner/Gelissen) ..................................................... 49
Lecture 6: Dummy predictor variables (Chapter 12 of Warner/Gelissen) ........................................ 58
Lecture 7: Multiple Regression (Chapter 14 of Warner/Gelissen) .................................................... 63
Lecture 8: Moderation (Chapter 15 of Warner/Gelissen) ................................................................. 70
Lecture 9: Path analysis (Chapter 11.9, 11.10, & 15 of Warner/Gelissen)........................................ 79
Lecture 10: Path analysis 2 (Chapter 11.9, 11.10, & 15 of Warner/Gelissen) ................................... 83
Lecture 11: Logistic regression (Chapter 16 of Warner/Gelissen) .................................................... 90
Lecture 12: Logistic regression 2 (Chapter 16 of Warner/Gelissen) ................................................. 99
Lecture 13: Example of logistic regression analysis (Chapter 16 of Warner/Gelissen) ................... 106
Lecture 14: Practice exam & SPSS test & Composition of final exam ............................................. 114
Why do you choose one or the other?
− Measurement level of the dependent variable(s) Y Are they mainly:
Categorical/nominal VS interval/ratio
− Measurement level of the independent variable(s) X
Categorical/nominal VS interval/ratio
− Complexity of theory: number of variables and relations and type of
relations
Overview of all Appendix:
Appendix A, pages: 686ʹ689 Proportions of Area Under a Standard Normal Curve
Appendix B, pages: 690 Critical Values for t Distribution
Appendix C, pages: 691ʹ693 Critical Values of F
Appendix D, pages: 694 Critical Values of Chi-Square
Appendix E, pages: 695 Critical Values of the Pearson Correlation Coefficient
1
,Which techniques will you learn, and why?
1. They are important because they help us to answer what and why research questions
2. They have in common: estimate how much the variance in a dependent variable Y
systematically varies with (‘co-varies’) the variance in other measured explanatory variable(s)
X; techniques assume that scores on dependent variable Y can be predicted by
a) X variables that we have measured and included as predictors that systematically affect
the dependent variable
b) variables that we have not measured and not included as predictors, but that
systematically affect the dependent variable ( ε → systematic error/residual)
c) variables that we have not measured and that only randomly affect the dependent
variable (also ε → random error/residual)
3. They are distinguished by:
(a) measurement levels of dependent variables (nominal, ordinal, interval, ratio)
(b) the measurement level of the explanatory variables/independent variables
(c) the number of variables the technique can deal with (complexity of the theory)
Complexity of associations
One-way Between-Subjects Analysis of Variance (ANOVA):
Important remark: we use the concepts ‘X variables’, ‘independent variables’, ‘explanatory variables’,
‘predictors’ interchangeably
Bivariate regression analysis:
Multiple regression analysis:
→ you have only one dependent var
iable (Y)
Path analysis:
Y
→ Only difference between 2 above: multiple dependent variables. Not only Y as dependent
variable, but also salary! = Extension of multiple regression analysis. Look at the arrows to identify
2
,the directions and dependent/independent variables.
Bivariate binary logistic regression analysis
→ Here the dependent variable has 2 categories/outcomes. For example becoming unemployed yes
or no. So, use when one or more predictor variables and a binary/dichotomous dependent variable
(only 2 answer categories) generally coded as 0 and 1.
Multiple binary logistic regression analysis
→ Here the dependent variable has 2 categories/outcomes. For example becoming unemployed yes
or no. So, use when one or more predictor variables and a binary/dichotomous dependent variable
(only 2 answer categories) generally coded as 0 and 1.
Why are these techniques important?
They are important because they help us to answer what and why RQs:
• What: usually descriptive RQ. E.g. the correlation between the level of education of parents
and the income of a child → to answer this; estimate the correlation coefficient between
these two variables.
• Why: becomes important when you learn techniques to answer the explanatory RQ.
! The measurement level of the DV determined to a very large extent which systematic method you
use. Measurement levels: nominal, ordinal, scale ʹ interval (no zero-point) and ratio (incl. zero-point)
(They must be all:
− Mutually exclusive (= categories can’t overlap)
− Exhaustive (= everyone should be able to find an answer within the categories).
Summary table: Few variables for ANOVA: not complex. Pearson’s r is not in this table (partial
correlation and multiple regression are based on Pearson’s r)
Dependent variable (Y)
Quantitative Qualitative
(Continuous: Interval/Ratio) (Nominal)
Independent Variables (X)
ANOVA (One-Way Between Table-analysis or Log-linear
Small number (1 or 2) Subjects Analysis of Variance) analysis
Qualitative (Few categorical X, one Y) (not part of this course)
Every number Bivariate Regression analysis Logistic Regression
Qualitative (one X, one Y) (Bivariate or Multiple)
and/or Multiple Regression analysis
Quantitative (many X, one Y)
Path Analysis
(mixing X and Y)
3
, → You can only calculate on average with a continuous variable
→ The difference is the measurement level
Lecture 1: One-Way Between-Subjects Analysis of Variance (Chapter 6.1 tm 6.9 of
Warner/Gelissen)
Logic of ANOVA
Substantive hypothesis (H1): A person’s degree of organizational commitment (Y) depends on the
team in which the person works (X)
− Question: if the hypothesis is correct, what would you expect to find with regard to
differences in average commitment between the teams?
− Imagine that we have collected data of measurements of organizational commitment for 3
teams
− 2 scenarios with regard to the data...
Fundamental principle of ANOVA:
ANOVA is a statistical analysis that tests whether there are statistically significant differences
between group means on scores on a quantitative outcome variable across two or more groups.
The test statistic, an F ratio, compares the magnitude of differences among group means (as indexed
by MSbetween) with the amount of variability of scores within groups that arises due to the influence of
error variables (indexed by MSwithin)
We see in scenario 2 that there is less variance within the team, therefore we see more clearly the
differences between the teams. We do have the same means; it is the variance that makes the
difference.
In which of the data scenarios would you be more inclined to conclude that there is a connection
between the team in which someone works and organizational commitment?
The second one! Why? Key idea of ANOVA/variance analysis is: When there are 2 or more groups,
can we make a statement about possible -significant- differences between the mean scores of the
groups? So we want small within group differences and big between group differences!
4