Stats
,Time series analysis
Definition: A time series is a sequence of observations collected at regular equally spaced intervals over a period of time
• Time series data, i.e. records that are measured sequentially over time, are extremely common. They arise in virtually
every application field, such as:
• Business
– Sales figures, production numbers, customer frequencies
• Economics
– Stock prices, exchange rates, interest rates
• Official Statistics
– Census data, personal expenditures, road casualties
Basic Time series assumptions
The factors that influenced patterns of activity in the past and present will continue to do so in more or less the same
manner in the future (i.e. we assume that past patterns will continue into the future).
Thus the overall purpose of time series analysis is to identify and isolate these influencing factors from the past in
order to better understand the process underlying the time series, for predictive purposes.
We can conduct a time series analysis to:
a) Develop a better understanding of the pattern of behavior present and the factors/components that have given
rise to that pattern
b) Develop a model that captures as much information from the time series as possible to forecast future values of
the time series
c) ... and other uses which we don’t consider in this course
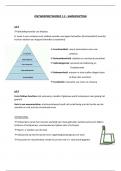
,Components of a Non-stationery time series
Trend (also known as Secular Trend) (T)
• The long-term tendency of a time series pattern to move steadily in an upward or downward direction, or stay the
same over time
e.g. population increases/decreases, consumer preferences etc.
• Can be linear or nonlinear over time
• Duration of the trend over the entire window of observation is much longer than a 1 time period
• We assume it can be predicted into the future
Cyclical variation (C)
• Irregular long-term wavelike movements through a time series (due to extended periods of prosperity/booms
followed by extended periods of recession, depression/troughs and recovery in the economy)
• Duration of the cycle is much more than 1 time period (a full cycle can last from 2 to 10 years)
• Generally the length of the cyclical variation is more than a year, and the duration is not fixed
• We assume it can be predicted because it appears to have a repetitive pattern
, Seasonal variation (S)
• Regular short-term repetitive wavelike movements through a time series, often when data is recorded hourly,
daily, weekly, monthly or quarterly.
e.g. daily traffic volume in Cape Town will display within-the-day “seasonal” behaviour, with peak levels
occurring between 8-9am and 4-5:30pm, and moderate flow during the rest of the day
• Can be predicted because the pattern is repeated many times. e.g.
- 24 hours in a day (hourly data)
- 7 days in a week (weekly data)
- 12 months in a year (monthly data)
- 4 seasons in a year (quarterly data)
Irregular/Random variation (R)
• Random variations in data due to the combined effects of all unforeseen events such as war, strikes, natural
disasters, power cuts, etc.
• Duration is short, and non repeating, emerges as variance
• There is no defined statistical technique for estimating random fluctuations in a time series i.e. they cannot be
predicted --- NB
• Tends to hide the existence of the other predictable components of a time series, especially when it is large
relative to the pattern in the data
Note: All time series include random variation.
In addition, a time series may include none, one, two or all of the other three components – trend, cyclical and
seasonal variation.
EXAMPLES
,Time series analysis
Definition: A time series is a sequence of observations collected at regular equally spaced intervals over a period of time
• Time series data, i.e. records that are measured sequentially over time, are extremely common. They arise in virtually
every application field, such as:
• Business
– Sales figures, production numbers, customer frequencies
• Economics
– Stock prices, exchange rates, interest rates
• Official Statistics
– Census data, personal expenditures, road casualties
Basic Time series assumptions
The factors that influenced patterns of activity in the past and present will continue to do so in more or less the same
manner in the future (i.e. we assume that past patterns will continue into the future).
Thus the overall purpose of time series analysis is to identify and isolate these influencing factors from the past in
order to better understand the process underlying the time series, for predictive purposes.
We can conduct a time series analysis to:
a) Develop a better understanding of the pattern of behavior present and the factors/components that have given
rise to that pattern
b) Develop a model that captures as much information from the time series as possible to forecast future values of
the time series
c) ... and other uses which we don’t consider in this course
,Components of a Non-stationery time series
Trend (also known as Secular Trend) (T)
• The long-term tendency of a time series pattern to move steadily in an upward or downward direction, or stay the
same over time
e.g. population increases/decreases, consumer preferences etc.
• Can be linear or nonlinear over time
• Duration of the trend over the entire window of observation is much longer than a 1 time period
• We assume it can be predicted into the future
Cyclical variation (C)
• Irregular long-term wavelike movements through a time series (due to extended periods of prosperity/booms
followed by extended periods of recession, depression/troughs and recovery in the economy)
• Duration of the cycle is much more than 1 time period (a full cycle can last from 2 to 10 years)
• Generally the length of the cyclical variation is more than a year, and the duration is not fixed
• We assume it can be predicted because it appears to have a repetitive pattern
, Seasonal variation (S)
• Regular short-term repetitive wavelike movements through a time series, often when data is recorded hourly,
daily, weekly, monthly or quarterly.
e.g. daily traffic volume in Cape Town will display within-the-day “seasonal” behaviour, with peak levels
occurring between 8-9am and 4-5:30pm, and moderate flow during the rest of the day
• Can be predicted because the pattern is repeated many times. e.g.
- 24 hours in a day (hourly data)
- 7 days in a week (weekly data)
- 12 months in a year (monthly data)
- 4 seasons in a year (quarterly data)
Irregular/Random variation (R)
• Random variations in data due to the combined effects of all unforeseen events such as war, strikes, natural
disasters, power cuts, etc.
• Duration is short, and non repeating, emerges as variance
• There is no defined statistical technique for estimating random fluctuations in a time series i.e. they cannot be
predicted --- NB
• Tends to hide the existence of the other predictable components of a time series, especially when it is large
relative to the pattern in the data
Note: All time series include random variation.
In addition, a time series may include none, one, two or all of the other three components – trend, cyclical and
seasonal variation.
EXAMPLES