,Logit model
Logistic regression, or logit regression, or logit model is a regression model where the dependent
variable (DV) is categorical. ... The binary logistic model is used to estimate the probability of a binary
response based on one or more predictor (or independent) variables (features).
The term refers to any problem where the values that the dependent variables may take are limited
to certain integers (e.g. 0, 1, 2, 3, 4) or even where it is a binary number (only 0 or 1). There are
numerous examples of instances where this may arise, for example where we want to model:
o Why firms choose to list their shares on the NASDAQ rather than the NYSE
o Why some stocks pay dividends while others do not
o What factors affect whether countries default on their sovereign deb
o Why some firms choose to issue new stock to finance an expansion while others
issue bonds
o Why some firms choose to engage in stock splits while others do not.
The logit model: empirical example
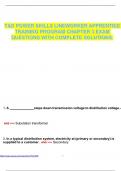
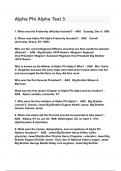
- The output looks like a linear regression output.
- The estimation is easy, the interpretation is different.
- The table above shows that just Inverse Leverage (MV) is significant, based on p-value. It is a
good default indicator.
- The graph above, shows the linear fit of the logit model.
o The linear fit is introduced to a function this explains the s-type curve in the graph
between 0 and 1.
, - If we have a normal distribution for the linear fit, then we have a probit model.
Consequently, if we get the logistic distribution of the fit, then we have a logit model.
Estimation of the models
- Estimation is done by Maximum Likelihood.
o Maximum Likelihood ask the following question: Given the data, and given a model,
what are parameters that maximize the probability of observing my sample?
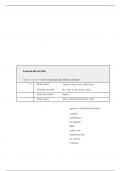
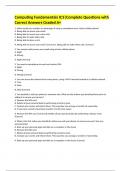
Building the ROC curve
FAR – False alarm rate is on the horizontal axis, x – axis while HR – Hit rate is on the vertical axis –
y axis.
STEP 0: raw data with pd fit False alarm rate Hit rate
obs pd-fit y 1
1 0,23 1
0,8
2 0,12 1
0,6
3 0,07 1
4 0,15 0 0,4
5 0,08 0 0,2
6 0,02 0 0
7 0,01 0 0 0,2 0,4 0,6 0,8 1
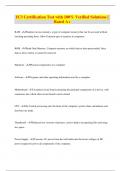
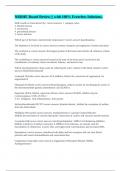
STEP 1: order on pd FAR HR
obs pd-fit y 0 0 1
1 0,23 1
0,8
4 0,15 0
0,6
2 0,12 1
5 0,08 0 0,4
3 0,07 1 0,2
6 0,02 0 0
7 0,01 0 0 0,2 0,4 0,6 0,8 1
- We count 3 "ones" and 4 "zeros"
- We are going to keep track of:
- the false alarm rate (FAR), i.e., the fraction of zeros out of the total number of zeros.
- B) the hit rate (HR), i.e., the fraction of "ones" out of the total number of "ones"
- HR on the VERTICAL axis
- FAR on the HORIZONTAL axis
- We start the plot at (0.0 , 0.0)
Logistic regression, or logit regression, or logit model is a regression model where the dependent
variable (DV) is categorical. ... The binary logistic model is used to estimate the probability of a binary
response based on one or more predictor (or independent) variables (features).
The term refers to any problem where the values that the dependent variables may take are limited
to certain integers (e.g. 0, 1, 2, 3, 4) or even where it is a binary number (only 0 or 1). There are
numerous examples of instances where this may arise, for example where we want to model:
o Why firms choose to list their shares on the NASDAQ rather than the NYSE
o Why some stocks pay dividends while others do not
o What factors affect whether countries default on their sovereign deb
o Why some firms choose to issue new stock to finance an expansion while others
issue bonds
o Why some firms choose to engage in stock splits while others do not.
The logit model: empirical example
- The output looks like a linear regression output.
- The estimation is easy, the interpretation is different.
- The table above shows that just Inverse Leverage (MV) is significant, based on p-value. It is a
good default indicator.
- The graph above, shows the linear fit of the logit model.
o The linear fit is introduced to a function this explains the s-type curve in the graph
between 0 and 1.
, - If we have a normal distribution for the linear fit, then we have a probit model.
Consequently, if we get the logistic distribution of the fit, then we have a logit model.
Estimation of the models
- Estimation is done by Maximum Likelihood.
o Maximum Likelihood ask the following question: Given the data, and given a model,
what are parameters that maximize the probability of observing my sample?
Building the ROC curve
FAR – False alarm rate is on the horizontal axis, x – axis while HR – Hit rate is on the vertical axis –
y axis.
STEP 0: raw data with pd fit False alarm rate Hit rate
obs pd-fit y 1
1 0,23 1
0,8
2 0,12 1
0,6
3 0,07 1
4 0,15 0 0,4
5 0,08 0 0,2
6 0,02 0 0
7 0,01 0 0 0,2 0,4 0,6 0,8 1
STEP 1: order on pd FAR HR
obs pd-fit y 0 0 1
1 0,23 1
0,8
4 0,15 0
0,6
2 0,12 1
5 0,08 0 0,4
3 0,07 1 0,2
6 0,02 0 0
7 0,01 0 0 0,2 0,4 0,6 0,8 1
- We count 3 "ones" and 4 "zeros"
- We are going to keep track of:
- the false alarm rate (FAR), i.e., the fraction of zeros out of the total number of zeros.
- B) the hit rate (HR), i.e., the fraction of "ones" out of the total number of "ones"
- HR on the VERTICAL axis
- FAR on the HORIZONTAL axis
- We start the plot at (0.0 , 0.0)