Modern Methods in Data Analysis
All notes are taken from the lecture material provided by the ‘Modern Methods in Data Analysis (Online)’
course offered by the MSc Epidemiology program of the UMC Utrecht and Utrecht University.
Learning Objectives
By the end of the course, you should be able to:
• Explain the principles of the likelihood theory and maximum likelihood methods
• Explain the principles of the following statistical analysis techniques: Logistic regression analysis, Poisson
regression analysis, Analysis of event history data, including the Cox proportional hazards regression model
• Explain model validation and regression diagnostics
• Describe the basic principles of longitudinal data analysis
• Apply the above-mentioned techniques using common statistical packages (for this course we use R)
• Name the situations in which these techniques can be applied and the conditions that should be met to obtain
reliable results using these techniques
• Explain and interpret the results obtained with these techniques, and apply these results in practice (e.g. to
answer a research question)
Course Structure
This course consists of 9 Learning Units, spread over 9 weeks.
• Learning Unit 1 - Linear Models
• Learning Unit 2 - Likelihood and Logistic Regression 1
• Learning Unit 3 - Logistic Regression 2
• Learning Unit 4 - Poisson models and generalized linear models
• Learning Unit 5 - Survival Analysis
• Learning Unit 6 - Resampling methods
• Learning Unit 7 - Longitudinal Data Analysis 1
• Learning Unit 8 - Longitudinal Data Analysis 2
• Learning Unit 9 - Final Exam and Course Closure
,Week 1 – Linear Models
Linear models: Continuous data and analysis of variance, Linear models and one-way ANOVA, Two-way
ANOVA, Regression analysis, Linear regression, Analysis of covariance (ANCOVA), Multiple regression.
Lecture 1.3 – Linear Models and One-Way ANOVA
All models fit under the multiple linear regression (the others are simplifications of this one).
Model for data-generating process population: yij = μ + (μi - μ) + εij
(i = group, j = observation number in group) obs = const + group effect + residual
Linear model for the ANOVA case is: yij = μ + (μi - μ) + εij
Assumptions: yij is normally distributed (yij ~ N (μi , σ2)) and σ is constant .
Alternatively: εij ~ N (0 , σ2) → this distribution of residuals is normally how you check the assumptions. (ε is
replaced with e, e is the residual from a sample)
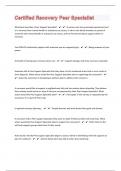
Steps in ANOVA analysis, see below chapter 1.
No differences between the groups implies 𝜇1 = 𝜇2 = 𝜇3 = ⋯
→ variance within the groups = variance between the groups, or
𝐹 = 𝑀𝑆𝐺𝑟𝑜𝑢𝑝 / 𝑀𝑆𝑅𝑒𝑠 ≈1
If group means are not all equal then variance between the groups will be (much) larger than the variance
within the groups
𝐹 = 𝑀𝑆𝐺𝑟𝑜𝑢𝑝 / 𝑀𝑆𝑅𝑒𝑠 ≫1
To test 𝐻0:𝜇1 = 𝜇2 = 𝜇3 = ⋯ against 𝐻1: at least one mean differs, use the result that F has an F distribution
,with degrees of freedom dfgroup and dfres
→Use this to calculate p-values
2 ways to get the ANOVA table in R:
Model
> model.an <- lm(y ~ factor(group))
Method 1. Both work for 1-way anova, but drop 1 is better for 2-way (because of single term deletion)
> drop1(model.an, test="F")
Single term deletions
Df Sum of Sq RSS AIC F value Pr(>F)
<none> 14.583 6.3397
factor(group) 1 16.333 30.917 13.3567 11.2 0.007407 **
Method 2.
> anova(model.an)
Df Sum Sq Mean Sq F value Pr(>F)
factor(group) 1 16.333 16.3333 11.2 0.007407 **
Residuals 10 14.583 1.4583
F = residual variance.
Anova: test if there are significant differences in means of different groups.
Drop1: construct ANOVA table, and check whether there are significant differences between groups.
Drop1 drops terms one by one to examine how the model fit changes. It can be used to construct the ANOVA
table.
Lecture 1.6 – Two-Way ANOVA
Two-way ANOVA: two grouping variables/factors (e.g. treatment vs placebo and low vs high dose (could be
more groups, still two-way ANOVA)). Possible combination effects of 2 factors are possible.
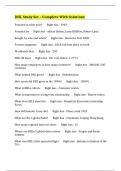
Two possibilities with two-way ANOVA:
1. No effect of both factors
2. Effect of one factor, e.g. (main effect of) treatment
3. Effect of other factor, e.g. (main effect of) dose
4. Effect of both factors, but effects are independent; an additive effect (no interactions).
5. Effect of both factors, effects are dependent; an interaction/effect modification.
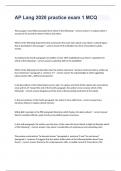
, 1 2 3
4 5 5 (other example)
So you look at the residuals to check the
normality assumptions
Analysis steps:
> Two-way ANOVA table
with 3 different F statistics:
1. Test differences between treatment groups (factor 1): F = MSgr / MSres
Follows an F-distribution with dfgr and dfres degrees of freedom.
2. Test differences between doses (factor 2): F = MSdose / MSres
Follows an F-distribution with dfdose and dfres degrees of freedom.
3. Test differences between treatment groups and dose (factor 1 and 2): F = MSinteraction / MSres
Follows an F-distribution with dfint and dfres degrees of freedom.
All notes are taken from the lecture material provided by the ‘Modern Methods in Data Analysis (Online)’
course offered by the MSc Epidemiology program of the UMC Utrecht and Utrecht University.
Learning Objectives
By the end of the course, you should be able to:
• Explain the principles of the likelihood theory and maximum likelihood methods
• Explain the principles of the following statistical analysis techniques: Logistic regression analysis, Poisson
regression analysis, Analysis of event history data, including the Cox proportional hazards regression model
• Explain model validation and regression diagnostics
• Describe the basic principles of longitudinal data analysis
• Apply the above-mentioned techniques using common statistical packages (for this course we use R)
• Name the situations in which these techniques can be applied and the conditions that should be met to obtain
reliable results using these techniques
• Explain and interpret the results obtained with these techniques, and apply these results in practice (e.g. to
answer a research question)
Course Structure
This course consists of 9 Learning Units, spread over 9 weeks.
• Learning Unit 1 - Linear Models
• Learning Unit 2 - Likelihood and Logistic Regression 1
• Learning Unit 3 - Logistic Regression 2
• Learning Unit 4 - Poisson models and generalized linear models
• Learning Unit 5 - Survival Analysis
• Learning Unit 6 - Resampling methods
• Learning Unit 7 - Longitudinal Data Analysis 1
• Learning Unit 8 - Longitudinal Data Analysis 2
• Learning Unit 9 - Final Exam and Course Closure
,Week 1 – Linear Models
Linear models: Continuous data and analysis of variance, Linear models and one-way ANOVA, Two-way
ANOVA, Regression analysis, Linear regression, Analysis of covariance (ANCOVA), Multiple regression.
Lecture 1.3 – Linear Models and One-Way ANOVA
All models fit under the multiple linear regression (the others are simplifications of this one).
Model for data-generating process population: yij = μ + (μi - μ) + εij
(i = group, j = observation number in group) obs = const + group effect + residual
Linear model for the ANOVA case is: yij = μ + (μi - μ) + εij
Assumptions: yij is normally distributed (yij ~ N (μi , σ2)) and σ is constant .
Alternatively: εij ~ N (0 , σ2) → this distribution of residuals is normally how you check the assumptions. (ε is
replaced with e, e is the residual from a sample)
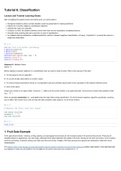
Steps in ANOVA analysis, see below chapter 1.
No differences between the groups implies 𝜇1 = 𝜇2 = 𝜇3 = ⋯
→ variance within the groups = variance between the groups, or
𝐹 = 𝑀𝑆𝐺𝑟𝑜𝑢𝑝 / 𝑀𝑆𝑅𝑒𝑠 ≈1
If group means are not all equal then variance between the groups will be (much) larger than the variance
within the groups
𝐹 = 𝑀𝑆𝐺𝑟𝑜𝑢𝑝 / 𝑀𝑆𝑅𝑒𝑠 ≫1
To test 𝐻0:𝜇1 = 𝜇2 = 𝜇3 = ⋯ against 𝐻1: at least one mean differs, use the result that F has an F distribution
,with degrees of freedom dfgroup and dfres
→Use this to calculate p-values
2 ways to get the ANOVA table in R:
Model
> model.an <- lm(y ~ factor(group))
Method 1. Both work for 1-way anova, but drop 1 is better for 2-way (because of single term deletion)
> drop1(model.an, test="F")
Single term deletions
Df Sum of Sq RSS AIC F value Pr(>F)
<none> 14.583 6.3397
factor(group) 1 16.333 30.917 13.3567 11.2 0.007407 **
Method 2.
> anova(model.an)
Df Sum Sq Mean Sq F value Pr(>F)
factor(group) 1 16.333 16.3333 11.2 0.007407 **
Residuals 10 14.583 1.4583
F = residual variance.
Anova: test if there are significant differences in means of different groups.
Drop1: construct ANOVA table, and check whether there are significant differences between groups.
Drop1 drops terms one by one to examine how the model fit changes. It can be used to construct the ANOVA
table.
Lecture 1.6 – Two-Way ANOVA
Two-way ANOVA: two grouping variables/factors (e.g. treatment vs placebo and low vs high dose (could be
more groups, still two-way ANOVA)). Possible combination effects of 2 factors are possible.
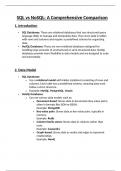
Two possibilities with two-way ANOVA:
1. No effect of both factors
2. Effect of one factor, e.g. (main effect of) treatment
3. Effect of other factor, e.g. (main effect of) dose
4. Effect of both factors, but effects are independent; an additive effect (no interactions).
5. Effect of both factors, effects are dependent; an interaction/effect modification.
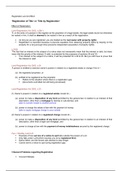
, 1 2 3
4 5 5 (other example)
So you look at the residuals to check the
normality assumptions
Analysis steps:
> Two-way ANOVA table
with 3 different F statistics:
1. Test differences between treatment groups (factor 1): F = MSgr / MSres
Follows an F-distribution with dfgr and dfres degrees of freedom.
2. Test differences between doses (factor 2): F = MSdose / MSres
Follows an F-distribution with dfdose and dfres degrees of freedom.
3. Test differences between treatment groups and dose (factor 1 and 2): F = MSinteraction / MSres
Follows an F-distribution with dfint and dfres degrees of freedom.