Statistics lecture 1
• Different types of statistics:
- Descriptive statistics: summarize your data.
- Inferential statistics: offers techniques for making statements about a larger set of observation
from data collected for a smaller set of observations. The mostly used sampling strategy is
random sampling.
- Multivariate statistics: moderation, mediation.
Inferential statistics: you want to generalize from a sample to the population. You test the significance
of your results.
- With inferential statistics, we draw a random sample.
- You calculate an average based on your sample and you generalize this to your population.
Probability distribution: The distribution of the candies tells you how lucky you are to get a certain
number of yellow candies. In 4 percent of the candy bags there is a number of 7 candies. The chance
of you getting 7 candies is thus 4 percent.
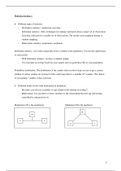
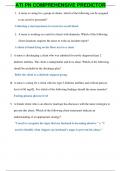
• Different kinds of tests with moderation & mediation:
- Bivariate: you use two variables (is age related to the amount of texting?)
- Multivariate: You use three or more variables (is the relationship between age and texting
controlled by education level).
Moderation (W is the moderator) Mediation (M is the mediator)
1
,Chapter 1
Collecting data: a researcher wants to make general statements applicable to the population. Collecting
data, however, is expensive. A researcher therefore tries to collect as little data as necessary.
Sampling space: the collection of all possible outcomes (if you have a bag of 10 candies and you want
to know all the possible outcomes for the number of yellow candies in the bag, the answer is then 10).
Sample statistic: a number describing a property of the sample. For instance, one bag contains four
yellow candies, another bag contains seven, and so on.
Random variable: the variable ‘amount of yellow candies in a bag’ is a random variable, because the
score of the variable depends on chance.
Sampling distribution: The distribution of the samples you selected.
Probability distribution: The probability of selecting a certain sample.
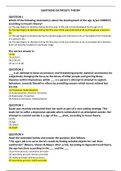
The expected value: the average of the sampling distribution of a random variable. In the sampling
distribution above (the blue one), the expected value is 2. The expected value equals the proportion of
the population, but only for all sample statistics that are unbiased estimators of the population
statistics.
Parameter: the population statistic.
2
,Biased estimators: the amount of yellow candies in a bag is a biased estimator for the amount of
yellow candies in the parameter. The proportion of the yellow candies in a bag is an unbiased
estimator for the proportion of yellow candies in the parameter.
A sample is representative of a population if variables in the sample are distributed in the same way
as in the population. A random sample is likely to differ from the population due to chance, so then we
say the sample is ‘in principle representative’ for the population.
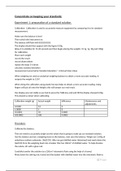
Continuous variable: a variable is continuous when there is always a new value to think of in-between
two values. An example is weight. Between the value 2 grams and 3 grams, there is an infinite amount
of different values in-between (for example, 2,390137 gram). Due to this, it is impossible to construct
a probability distribution of the sampling space. You cannot calculate the chance of having a candy
bag of 2,8 grams, because the chance of finding a candy bag that exactly weighs 2,8 grams (and not
2,800001 grams) is very small. This problem can be solved by taking a range of values instead of a
single value. For example, the weight between 2,75 and 2,85. The distribution then has to be portrayed
differently. It is called a probability density function and it is a curve.
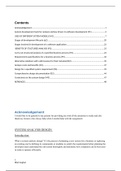
This is a normal distribution. The probability of values up to the threshold value (= in this case 2,8)
and higher are called ‘p values’. The probability of values up and including the threshold value is
known as the left-hand p value and the probability of values above and including the threshold value is
called the right-hand p value.
3
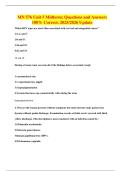
, The sampling distribution sticks to
the population because the
population statistic (parameter), for
example, the average weight of all
candies, is equal to the mean of the
sampling distribution. The sampling
distribution sticks to the sample
because it tells us which sample
means we will find with what
probabilities. The sampling
distribution is the vital link
connecting the sample to the
population. We need it to make
statements about the population
based on our sample.
Chapter 2
Bootstrap sample: when a large sample from the initial sample is drawn. For each bootstrap sample,
the sample statistic of interest is calculated and we collect these as our sampling distribution. We
usually want about 5000 bootstrap samples for our sampling distribution. To construct a sampling
distribution from bootstrap samples, the bootstrap samples must be exactly as large as the original
sample. If we allow every case in the original sample to be samples only once, each bootstrap sample
contains all cases of the original sample, so it is an exact copy of the original sample. Different
bootstrap samples could thus not be created. If we do allow the same case to be chosen more than
once, we sample with ‘replacement’. The same case can occur more than once in a sample. Bootstrap
samples that are samples with replacement can vary. The probability of picking a certain color always
stays the same with sampling with replacement. It is ok to sample without replacement as long as the
population is much larger than the sample. If the population is much larger, the probabilities more or
less remain the same during the sampling process, so calculating probabilities as if the probabilities do
not change is not a problem. The bootstrap distribution resembles the true sampling distribution that
we would get if we draw lots of samples directly from the population. Yet, this can only happen when
the initial sample is not too small and more or less representative of the population. The main problem
with the bootstrap approach is that there is a chance that the sample does not reflect the population
4
• Different types of statistics:
- Descriptive statistics: summarize your data.
- Inferential statistics: offers techniques for making statements about a larger set of observation
from data collected for a smaller set of observations. The mostly used sampling strategy is
random sampling.
- Multivariate statistics: moderation, mediation.
Inferential statistics: you want to generalize from a sample to the population. You test the significance
of your results.
- With inferential statistics, we draw a random sample.
- You calculate an average based on your sample and you generalize this to your population.
Probability distribution: The distribution of the candies tells you how lucky you are to get a certain
number of yellow candies. In 4 percent of the candy bags there is a number of 7 candies. The chance
of you getting 7 candies is thus 4 percent.
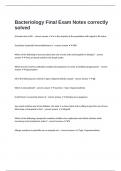
• Different kinds of tests with moderation & mediation:
- Bivariate: you use two variables (is age related to the amount of texting?)
- Multivariate: You use three or more variables (is the relationship between age and texting
controlled by education level).
Moderation (W is the moderator) Mediation (M is the mediator)
1
,Chapter 1
Collecting data: a researcher wants to make general statements applicable to the population. Collecting
data, however, is expensive. A researcher therefore tries to collect as little data as necessary.
Sampling space: the collection of all possible outcomes (if you have a bag of 10 candies and you want
to know all the possible outcomes for the number of yellow candies in the bag, the answer is then 10).
Sample statistic: a number describing a property of the sample. For instance, one bag contains four
yellow candies, another bag contains seven, and so on.
Random variable: the variable ‘amount of yellow candies in a bag’ is a random variable, because the
score of the variable depends on chance.
Sampling distribution: The distribution of the samples you selected.
Probability distribution: The probability of selecting a certain sample.
The expected value: the average of the sampling distribution of a random variable. In the sampling
distribution above (the blue one), the expected value is 2. The expected value equals the proportion of
the population, but only for all sample statistics that are unbiased estimators of the population
statistics.
Parameter: the population statistic.
2
,Biased estimators: the amount of yellow candies in a bag is a biased estimator for the amount of
yellow candies in the parameter. The proportion of the yellow candies in a bag is an unbiased
estimator for the proportion of yellow candies in the parameter.
A sample is representative of a population if variables in the sample are distributed in the same way
as in the population. A random sample is likely to differ from the population due to chance, so then we
say the sample is ‘in principle representative’ for the population.
Continuous variable: a variable is continuous when there is always a new value to think of in-between
two values. An example is weight. Between the value 2 grams and 3 grams, there is an infinite amount
of different values in-between (for example, 2,390137 gram). Due to this, it is impossible to construct
a probability distribution of the sampling space. You cannot calculate the chance of having a candy
bag of 2,8 grams, because the chance of finding a candy bag that exactly weighs 2,8 grams (and not
2,800001 grams) is very small. This problem can be solved by taking a range of values instead of a
single value. For example, the weight between 2,75 and 2,85. The distribution then has to be portrayed
differently. It is called a probability density function and it is a curve.
This is a normal distribution. The probability of values up to the threshold value (= in this case 2,8)
and higher are called ‘p values’. The probability of values up and including the threshold value is
known as the left-hand p value and the probability of values above and including the threshold value is
called the right-hand p value.
3
, The sampling distribution sticks to
the population because the
population statistic (parameter), for
example, the average weight of all
candies, is equal to the mean of the
sampling distribution. The sampling
distribution sticks to the sample
because it tells us which sample
means we will find with what
probabilities. The sampling
distribution is the vital link
connecting the sample to the
population. We need it to make
statements about the population
based on our sample.
Chapter 2
Bootstrap sample: when a large sample from the initial sample is drawn. For each bootstrap sample,
the sample statistic of interest is calculated and we collect these as our sampling distribution. We
usually want about 5000 bootstrap samples for our sampling distribution. To construct a sampling
distribution from bootstrap samples, the bootstrap samples must be exactly as large as the original
sample. If we allow every case in the original sample to be samples only once, each bootstrap sample
contains all cases of the original sample, so it is an exact copy of the original sample. Different
bootstrap samples could thus not be created. If we do allow the same case to be chosen more than
once, we sample with ‘replacement’. The same case can occur more than once in a sample. Bootstrap
samples that are samples with replacement can vary. The probability of picking a certain color always
stays the same with sampling with replacement. It is ok to sample without replacement as long as the
population is much larger than the sample. If the population is much larger, the probabilities more or
less remain the same during the sampling process, so calculating probabilities as if the probabilities do
not change is not a problem. The bootstrap distribution resembles the true sampling distribution that
we would get if we draw lots of samples directly from the population. Yet, this can only happen when
the initial sample is not too small and more or less representative of the population. The main problem
with the bootstrap approach is that there is a chance that the sample does not reflect the population
4