Data Analytics - Summary
Utrecht University, Informatiekunde
2020-2021, blok 2
Lecturer: Dr. Michael Behrisch
Summary: Ayco Geul
Course Structure
1 Basics 2
1.1 Introduction 2
1.2 Definitions and Concepts 2
1.3 Data Foundation 5
Types of Data 5
Typical Data Classes 5
Data Preprocessing 7
Data cleaning 7
1. Binning (Local Smoothing) 8
2. Regression 8
3. Clustering 10
Normalization 11
Segmentation 11
Data reduction 12
Reduce the number of data points 12
Reduce the number of dimensions 14
2 Data Mining 17
2.1 Classification 17
2.1.1 Decision Trees 19
2.1.2 Naive Bayes Classifier 24
Bayes Classifier 24
2.1.3 Support Vector Machines 28
Linear SVM 28
Non-linear SVM 29
2.1.4 K-Nearest Neighbor Classifier (k-NN) 31
2.1.5 (Artificial) Neural Networks (ANN) 33
Basic understanding of NN 33
What are synapses (inhibition and excitation) 33
Activation function (Threshold for firing) 34
Output? 34
Learning 34
2.1.6 Deep Learning 36
2.2 Clustering and Outlier Analysis 42
2.2.1 Introduction 42
2.2.2 Clustering Methods 43
, 2.2.2.1 Partitioning Method 43
k-Medoids Clustering 43
2.2.2.2 Hierarchical-based Methods 46
2.2.2.3 Density-based Methods 48
2.2.2.4 Other Methods 50
Optics (DBSCAN including hierarchical methods) 50
2.2.3 Conclusion 51
2.3 Association Rules 52
2.3.1 Introduction 52
Market basket analysis 52
2.3.2 Frequent itemset mining 52
2.3.3 Mining various kinds of association rules 56
2.3.4 Conclusion 57
3 Visualization 58
3.1 Human perception 58
3.2 Design of Data Visualization Techniques 59
3.3 - for Non-Spatial Data 59
3.4 - for Temporal Data 59
3.5 - for Geo-Spatial Data 59
3.6 - for Spatial Data 59
1
,1 Basics
1.1 Introduction
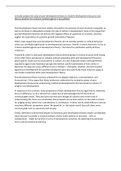
1.2 Definitions and Concepts
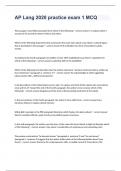
KDD - Knowledge Discovery in Databases
- Process of semi-automatic extraction of knowledge from databases which is valid,
unknown and (potentially) useful
KDD is an interdisciplinary field
KDD Process Model
The process until data transformation costs 70% of the effort.
This model is an interactive and iterative process - It can go back and forth.
Beware! Different usages of terms in Data Analytics.
2
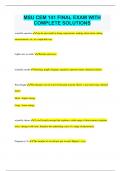
, Visualization = representation form to gain a better understanding about the data.
“Visualization is the process of presenting data in a form that allows
rapid understanding of relationships and findings that are not readily
evident from raw data.”
A model = an abstract representation of data.
Data
Data has many sources: sensors, surveys, computations, simulations, etc…
Independent of the source, all data has a data type
Goals of visualization:
1. Presentation
a. Starting point: facts to be presented are fixed a priori
b. Process: choice of appropriate presentation techniques
c. Result: high quality visualization of the data to present facts
2. Confirmatory Analysis
a. Starting point: hypotheses about the data
b. Process: goal oriented examination of the hypotheses
c. Result: visualization of data to confirm or reject the hypotheses
3. Exploratory Analysis
a. Starting point: no hypotheses about the data
b. Process: interactive, usually undirected search for structures, trends
c. Result: visualization of data to lead to hypotheses about the data
3
Utrecht University, Informatiekunde
2020-2021, blok 2
Lecturer: Dr. Michael Behrisch
Summary: Ayco Geul
Course Structure
1 Basics 2
1.1 Introduction 2
1.2 Definitions and Concepts 2
1.3 Data Foundation 5
Types of Data 5
Typical Data Classes 5
Data Preprocessing 7
Data cleaning 7
1. Binning (Local Smoothing) 8
2. Regression 8
3. Clustering 10
Normalization 11
Segmentation 11
Data reduction 12
Reduce the number of data points 12
Reduce the number of dimensions 14
2 Data Mining 17
2.1 Classification 17
2.1.1 Decision Trees 19
2.1.2 Naive Bayes Classifier 24
Bayes Classifier 24
2.1.3 Support Vector Machines 28
Linear SVM 28
Non-linear SVM 29
2.1.4 K-Nearest Neighbor Classifier (k-NN) 31
2.1.5 (Artificial) Neural Networks (ANN) 33
Basic understanding of NN 33
What are synapses (inhibition and excitation) 33
Activation function (Threshold for firing) 34
Output? 34
Learning 34
2.1.6 Deep Learning 36
2.2 Clustering and Outlier Analysis 42
2.2.1 Introduction 42
2.2.2 Clustering Methods 43
, 2.2.2.1 Partitioning Method 43
k-Medoids Clustering 43
2.2.2.2 Hierarchical-based Methods 46
2.2.2.3 Density-based Methods 48
2.2.2.4 Other Methods 50
Optics (DBSCAN including hierarchical methods) 50
2.2.3 Conclusion 51
2.3 Association Rules 52
2.3.1 Introduction 52
Market basket analysis 52
2.3.2 Frequent itemset mining 52
2.3.3 Mining various kinds of association rules 56
2.3.4 Conclusion 57
3 Visualization 58
3.1 Human perception 58
3.2 Design of Data Visualization Techniques 59
3.3 - for Non-Spatial Data 59
3.4 - for Temporal Data 59
3.5 - for Geo-Spatial Data 59
3.6 - for Spatial Data 59
1
,1 Basics
1.1 Introduction
1.2 Definitions and Concepts
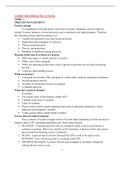
KDD - Knowledge Discovery in Databases
- Process of semi-automatic extraction of knowledge from databases which is valid,
unknown and (potentially) useful
KDD is an interdisciplinary field
KDD Process Model
The process until data transformation costs 70% of the effort.
This model is an interactive and iterative process - It can go back and forth.
Beware! Different usages of terms in Data Analytics.
2
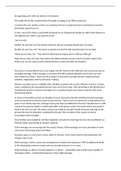
, Visualization = representation form to gain a better understanding about the data.
“Visualization is the process of presenting data in a form that allows
rapid understanding of relationships and findings that are not readily
evident from raw data.”
A model = an abstract representation of data.
Data
Data has many sources: sensors, surveys, computations, simulations, etc…
Independent of the source, all data has a data type
Goals of visualization:
1. Presentation
a. Starting point: facts to be presented are fixed a priori
b. Process: choice of appropriate presentation techniques
c. Result: high quality visualization of the data to present facts
2. Confirmatory Analysis
a. Starting point: hypotheses about the data
b. Process: goal oriented examination of the hypotheses
c. Result: visualization of data to confirm or reject the hypotheses
3. Exploratory Analysis
a. Starting point: no hypotheses about the data
b. Process: interactive, usually undirected search for structures, trends
c. Result: visualization of data to lead to hypotheses about the data
3