Summary Decision making in supply chains
By Pepijn Paans
Student 2016 – 2017
MSc Transport & Supply Chain Management
FACEBOOK: https://www.facebook.com/pepijn.paans
LINKEDIN: https://www.linkedin.com/in/pepijn-paans-6b828a80
EMAIL:
,Book(s):
• Anderson et al. (2014): an introduction to management science – quantitative
approaches to decision making
By: Pepijn Paans, Graduate student Business Administration: Transport and supply chain
management.
Chapter 1: introduction
Management science is identified as helping people make better decisions.
It applies advanced analytical methods to business decision problems.
Decision areas for management science:
- Assignment: assignment of resources with a certain goal (min cost/ max profit etc.)
- Data mining: identifying and analysing relevant information.
- Financial decision making:
- Forecasting
- Logistics
- Marketing
- Networks: how quickly and efficiently do things flow/move through a network
- Optimization: an organization looking for the best or optimal solution
- Project planning and management
- Queuing: decisions regarding ques
- Simulation: experimenting before making a major decision
- Transportation: decisions about effectively and efficiently transporting
Management scientists use a logical, systematic and analytical method when looking at
decision problems.
1) Problem recognition (performance monitoring and observation to spot problems)
2) Problem structuring and definition (understanding the problem in context)
3) Modelling and analysis (quantitative – hard MS – and qualitative – soft MS)
- soft MS: focuses on the people making the decision rather than the decision
problem itself: verbal problem descriptions
- hard MS: focuses primarily on the decision problem, applies mathematical and
statistical techniques to find a solution.
4) Solution and recommendations: usually multiple options, in certain context.
5) Implementation: extensive user involvement in identifying the problem helps
when implementing a solution.
The circle is now complete and we need to again observe if the implemented solution is
working. In practice, this method is not a straight line (circle) but requires jumping back and
forth between stages to improve the process step by step.
Iconic models are physical replicas of something (say a scale model of an airplane)
,Mathematical models are a system of symbols and quantitative relationships or expressions
This makes use of parameters which are known constant values, say the selling price of a
carton of eggs. However, sometimes parameters need to be estimated using the best
available data. This may affect the reliability of the model.
Using models is quicker and less expensive and reduces risk associated with experimenting
with the real situation.
Cost and volume models:
The cost of manufacturing or producing a product is a function of the volume produced.
Usually costs are built up of fixed costs and variable costs. C(x)=3000 +2x
Revenue and volume models:
Revenue depend on the selling price and the number of units sold. R(x)=5x
Profit and volume models:
How does volume affect profits. P(x) = R(x) - C(x)= -3000 + 3x
Break even analysis:
How many units need to be produced to break even (R(x) = C(x)) i.e. no profit is made.
3000 + 2x = 5x à x = 1000
several types of models and techniques:
- Linear programming
- Transportation and assignment
- Network models
- Project management
- Inventory models
- Queuing models
- Simulation
- Decision analysis
- Multi criteria analysis
- Integer linear programming
- Forecasting
- Dynamic programming
- Markov process models
Chapter 2: an introduction to linear programming
Linear programming helps in situations where the goal is to make the best decision possible,
but where the possible options limit or constraint what you are able to do.
All linear programming (LP) problems have an objective of minimizing or maximizing a
certain quantity. Moreover, there is always a restriction or constraint to which the objective
can be pursued.
, Graphical solution procedure (GulfGolf problem)
1. Problem formulation
- Describe the objective: maximize the total contribution to profit
- Describe each constraint: cutting and dying time, sewing time, finishing time and
inspection time available over a course of three months.
- Define the decision variables: # standard bags produced (S), # deluxe bags produced
(D)
- Write the objective in terms of decision variables: total profit = $10*S + $9*D
This is called the objective function: Max 10S + 9D
- Write the constraints in terms of decision variables.
“ hours x amount produced of each bag must be smaller than or equal to constraint”
Cutting and dying: 7/10S + 1D <= 630
Sewing: 1/2S + 5/6D <= 600
Finishing: 1S + 2/3D <= 708
Inspection, packaging : 1/10S + 1/4D <=135
S >= 0, D>= 0 i.e. no negative production: nonnegativity constraints
We now only need to find the product mix of S and D that satisfies all the constraints
and at the same time yields the maximum possible value for the objective function.
All the objective and constraint functions are linear functions of the decision
variables and therefore this is a linear programming model.
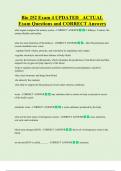
We can graph the constraints by finding any two points of the constrain formula that
satisfy the equality of the formula. E.g. 7/10S + 1 D = 630 à D=630 (S=0) S=900 (D=0)
For the constraint put as: 7/10S + 1D < 630 we find that only the points underneath
the constraint line satisfy. These solutions will be different for all the different
constrain formulas.
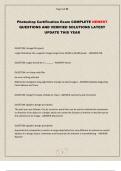
We need to identify the solution points that satisfy all the constraints simultaneously.
We can do this by drawing all the constraints on one graph and observe the region
containing the points that satisfy all the constraints simultaneously. This is where all
the areas overlap and are called the feasible region. Containing all the feasible
solutions.
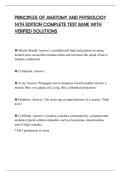
We can now try to find all the feasible solutions for a certain arbitrary value of profit,
say $1800 profit.
10S + 9D = $1800, this will be a straight line again, so finding two points will give us a
solution of all the feasible solutions that generate $1800 profit.
We find: S=0, D=200 ; S=180, D=0
By Pepijn Paans
Student 2016 – 2017
MSc Transport & Supply Chain Management
FACEBOOK: https://www.facebook.com/pepijn.paans
LINKEDIN: https://www.linkedin.com/in/pepijn-paans-6b828a80
EMAIL:
,Book(s):
• Anderson et al. (2014): an introduction to management science – quantitative
approaches to decision making
By: Pepijn Paans, Graduate student Business Administration: Transport and supply chain
management.
Chapter 1: introduction
Management science is identified as helping people make better decisions.
It applies advanced analytical methods to business decision problems.
Decision areas for management science:
- Assignment: assignment of resources with a certain goal (min cost/ max profit etc.)
- Data mining: identifying and analysing relevant information.
- Financial decision making:
- Forecasting
- Logistics
- Marketing
- Networks: how quickly and efficiently do things flow/move through a network
- Optimization: an organization looking for the best or optimal solution
- Project planning and management
- Queuing: decisions regarding ques
- Simulation: experimenting before making a major decision
- Transportation: decisions about effectively and efficiently transporting
Management scientists use a logical, systematic and analytical method when looking at
decision problems.
1) Problem recognition (performance monitoring and observation to spot problems)
2) Problem structuring and definition (understanding the problem in context)
3) Modelling and analysis (quantitative – hard MS – and qualitative – soft MS)
- soft MS: focuses on the people making the decision rather than the decision
problem itself: verbal problem descriptions
- hard MS: focuses primarily on the decision problem, applies mathematical and
statistical techniques to find a solution.
4) Solution and recommendations: usually multiple options, in certain context.
5) Implementation: extensive user involvement in identifying the problem helps
when implementing a solution.
The circle is now complete and we need to again observe if the implemented solution is
working. In practice, this method is not a straight line (circle) but requires jumping back and
forth between stages to improve the process step by step.
Iconic models are physical replicas of something (say a scale model of an airplane)
,Mathematical models are a system of symbols and quantitative relationships or expressions
This makes use of parameters which are known constant values, say the selling price of a
carton of eggs. However, sometimes parameters need to be estimated using the best
available data. This may affect the reliability of the model.
Using models is quicker and less expensive and reduces risk associated with experimenting
with the real situation.
Cost and volume models:
The cost of manufacturing or producing a product is a function of the volume produced.
Usually costs are built up of fixed costs and variable costs. C(x)=3000 +2x
Revenue and volume models:
Revenue depend on the selling price and the number of units sold. R(x)=5x
Profit and volume models:
How does volume affect profits. P(x) = R(x) - C(x)= -3000 + 3x
Break even analysis:
How many units need to be produced to break even (R(x) = C(x)) i.e. no profit is made.
3000 + 2x = 5x à x = 1000
several types of models and techniques:
- Linear programming
- Transportation and assignment
- Network models
- Project management
- Inventory models
- Queuing models
- Simulation
- Decision analysis
- Multi criteria analysis
- Integer linear programming
- Forecasting
- Dynamic programming
- Markov process models
Chapter 2: an introduction to linear programming
Linear programming helps in situations where the goal is to make the best decision possible,
but where the possible options limit or constraint what you are able to do.
All linear programming (LP) problems have an objective of minimizing or maximizing a
certain quantity. Moreover, there is always a restriction or constraint to which the objective
can be pursued.
, Graphical solution procedure (GulfGolf problem)
1. Problem formulation
- Describe the objective: maximize the total contribution to profit
- Describe each constraint: cutting and dying time, sewing time, finishing time and
inspection time available over a course of three months.
- Define the decision variables: # standard bags produced (S), # deluxe bags produced
(D)
- Write the objective in terms of decision variables: total profit = $10*S + $9*D
This is called the objective function: Max 10S + 9D
- Write the constraints in terms of decision variables.
“ hours x amount produced of each bag must be smaller than or equal to constraint”
Cutting and dying: 7/10S + 1D <= 630
Sewing: 1/2S + 5/6D <= 600
Finishing: 1S + 2/3D <= 708
Inspection, packaging : 1/10S + 1/4D <=135
S >= 0, D>= 0 i.e. no negative production: nonnegativity constraints
We now only need to find the product mix of S and D that satisfies all the constraints
and at the same time yields the maximum possible value for the objective function.
All the objective and constraint functions are linear functions of the decision
variables and therefore this is a linear programming model.
We can graph the constraints by finding any two points of the constrain formula that
satisfy the equality of the formula. E.g. 7/10S + 1 D = 630 à D=630 (S=0) S=900 (D=0)
For the constraint put as: 7/10S + 1D < 630 we find that only the points underneath
the constraint line satisfy. These solutions will be different for all the different
constrain formulas.
We need to identify the solution points that satisfy all the constraints simultaneously.
We can do this by drawing all the constraints on one graph and observe the region
containing the points that satisfy all the constraints simultaneously. This is where all
the areas overlap and are called the feasible region. Containing all the feasible
solutions.
We can now try to find all the feasible solutions for a certain arbitrary value of profit,
say $1800 profit.
10S + 9D = $1800, this will be a straight line again, so finding two points will give us a
solution of all the feasible solutions that generate $1800 profit.
We find: S=0, D=200 ; S=180, D=0