Examen
Information_Visualization_Week3_NEC_Solved
Puntuación
Vendido
-
Páginas
9
Grado
A+
Subido en
24-08-2023
Escrito en
2023/2024
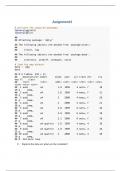
Create a scatter plot of gdp v life expectancy for five countries over a period of years. Show each country in a different color. Add a trend line. Comment your code line by line. Explain in a paragraph of at least five sentences what the chart is showing. Submit an R Markdown file with interpretations of each chart. Do not copy. Your work should be your own Your writing should be in your own words.
Mostrar más
Leer menos
Institución
Information Visualization
Grado
Information Visualization
Ups! No podemos cargar tu documento ahora. Inténtalo de nuevo o contacta con soporte.
Libro relacionado
Data Visualization
- 2018
- 9780691181622
- Desconocido
Escuela, estudio y materia
- Institución
- Information Visualization
- Grado
- Information Visualization
Información del documento
- Subido en
- 24 de agosto de 2023
- Número de páginas
- 9
- Escrito en
- 2023/2024
- Tipo
- Examen
- Contiene
- Preguntas y respuestas
Temas
-
informationvisualizationweek3necsolved
$10.49
Accede al documento completo:
¿Documento equivocado? Cámbialo gratis
Dentro de los 14 días posteriores a la compra y antes de descargarlo, puedes elegir otro documento. Puedes gastar el importe de nuevo.
Escrito por estudiantes que aprobaron
Inmediatamente disponible después del pago
Leer en línea o como PDF
Documento también disponible en un lote
Package deal
Information_Visualization_NEC_All_7_Weeks_Solved
8
2023
$ 83.92
Más información