The Global Macroeconomy
1
1. The data in Table 1-1 end in 2009. Visit the U.S. Bureau of Economic Analysis at
bea.gov to find information for the latest full calendar year (or for the last four quar-
ters). What is the latest estimate of the size of the annual U.S. current account deficit
in billions of dollars?
Answer: Answers will vary.
2. The data in Figure 1-1 end in 2010.Visit oanda.com and download data on the same
exchange rates (yuan per dollar and dollar per euro) for the past 12 months. What are
the rates today? What were they a year ago? By what percentage amount did the rates
change? At oanda.com, click on “Currency Tools” and then “FXGraph” and use the
tool to plot the last year of data for each exchange rate. Do you think the rates are
floating or fixed?
Answer: Answers will vary. The yuan per dollar exchange rate is fixed (with occa-
sional changes in value) and the euro–dollar exchange rate is floating.
3. The data in Figure 1-3 are for the year 2005. Find the IMF’s World Economic Out-
look Databases. (Hint: Google “World Economic Outlook Databases.”) Use this in-
teractive tool to obtain the latest data on current accounts in U.S. dollars for all coun-
tries (actual data or IMF estimates). Which countries had the 10 largest deficits last
year? Which countries had the 10 largest surpluses last year?
Answer: Answers will vary. As of October 25, 2010, the 10 countries with the largest
current account deficits were:
Country 2008 2009 2010
United States –668.856 –378.434 –466.513
Spain –155.962 –81.198 –71.92
Italy –78.874 –67.151 –58.272
France –54.629 –51.287 –45.743
Australia –47.477 –43.693 –29.828
Canada –6.483 –38.075 –44.245
Greece –51.212 –37.092 –33.053
India –25.48 –35.672 –44.093
Brazil –28.192 –24.302 –51.822
United Kingdom –44.063 –24.259 –50.31
S-1
,S-2 Solutions ■ Chapter 1 The Global macroeconomy
The 10 economies with the largest current account surpluses were:
Country 2008 2009 2010
Singapore 35.815 32.387 44.481
Switzerland 10.234 41.697 50.004
Korea –5.776 42.668 26.041
Netherlands 41.978 42.702 44.024
Taiwan Province of China 27.505 42.916 42.639
Russia 103.722 49.518 69.828
Norway 79.885 49.58 68.572
Japan 157.079 141.751 166.463
Germany 245.722 163.256 200.188
China 436.107 297.1 269.87
4. Figure 1-6 presents data on country risk (emerging market interest rate spreads) for
2005.Visit the Financial Times Web site (at http://www.ft.com; in the drop down list un-
der “Markets” click on “Markets Data”) to download data for country risk today. (Hint:
Google “FT high yield emerging markets.”) Which three emerging-market countries
have the highest spreads on their U.S. dollar debt? Which three have the lowest?
Answer: Answers will vary.
5. The map at the end of the chapter shows the World Bank’s composite governance in-
dicator. The World Bank has prepared other indicators to measure institutional dif-
ferences among countries. Use the Internet to find the World Bank’s “Ease of Doing
Business Map.” (Hint: Again, use Google.) Do you notice a correlation between the
ease of doing business and the overall governance indicator? Can you find countries
that rank high on the ease of doing business indicator but low on the governance in-
dicator? Are these countries rich or poor? (Hint: Look up their GNI per person at
the World Bank by googling “world bank GNI per capita.”)
Answer: There is a positive relationship between the governance quality indicators
and the ease of doing business. There are examples of countries that rank high on the
ease of business but low on governance, such as Thailand, Tonga, Mongolia, China,
Georgia, Armenia, Romania, Saudi Arabia, Peru, Belize, and Sri Lanka. Most of these
are developing, low-income countries. Saudi Arabia, ranked roughly 50th in the world
in terms of income per person, is a notable exception.
, Solutions ■ Chapter 1 The Global macroeconomy S-3
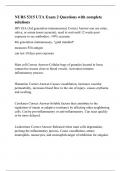
6. The following charts show the growth of real GDP per capita in three pairs of geo-
graphically adjacent countries: North and South Korea, Argentina and Chile, and
Zimbabwe and Botswana (using data from the Penn World Table).
Real GDP Real GDP Real GDP
per capita per capita per capita
$20,000 $14,000 $10,000
South Korea
18,000 9,000
12,000 Botswana
16,000 Argentina 8,000
14,000 10,000 7,000
12,000 8,000 6,000
10,000 Chile 5,000
8,000 6,000 4,000
6,000 4,000 3,000
Zimbabwe
4,000 2,000
North Korea 2,000
2,000 1,000
0 0 0
1950 1960 1970 1980 1990 2000 1950 1960 1970 1980 1990 2000 1950 1960 1970 1980 1990 2000
a. Which country in each pair experienced faster growth in GDP per capita?
Which one is now richest?
Answer: South Korea experienced faster growth than North Korea. Argentina
experienced faster growth than Chile between 1970 and 1990, but Chile’s
growth rate was higher than Argentina’s between 1990 and 2000. Botswana has
grown faster than Zimbabwe since 1970. As of 2006, the richest countries are:
South Korea, Chile, and Botswana.
b. The World Bank’s World Governance Indicators for each country in 2000 were
as follows (higher is better). Based on these data, do you think institutions can
explain the divergent outcomes in these countries? Explain. Why do you think
it helps to compare countries that are physically contiguous?
Political Stability
Control of Government and Absence Rule Regulatory Voice and
Corruption Effectiveness of Violence of Law Quality Accountability
South Korea 0.37 0.63 0.49 0.64 0.47 0.76
North Korea ⫺0.93 ⫺1.10 ⫺0.66 ⫺1.08 ⫺1.70 ⫺2.02
Chile 1.56 1.34 0.85 1.31 1.38 0.56
Argentina ⫺0.34 0.28 0.48 0.17 0.45 0.44
Botswana 1.02 0.98 0.90 0.67 0.79 0.78
Zimbabwe ⫺0.87 ⫺1.13 ⫺1.21 ⫺0.74 ⫺1.61 ⫺0.97
Answer: South Korea has consistently higher governance ratings than North
Korea. Similarly, Chile’s are higher than Argentina’s ratings, and Botswana’s are
higher than Zimbabwe’s. Based on the information for these six countries, it ap-
pears as though quality governance is associated with higher economic growth.
,
1
1. The data in Table 1-1 end in 2009. Visit the U.S. Bureau of Economic Analysis at
bea.gov to find information for the latest full calendar year (or for the last four quar-
ters). What is the latest estimate of the size of the annual U.S. current account deficit
in billions of dollars?
Answer: Answers will vary.
2. The data in Figure 1-1 end in 2010.Visit oanda.com and download data on the same
exchange rates (yuan per dollar and dollar per euro) for the past 12 months. What are
the rates today? What were they a year ago? By what percentage amount did the rates
change? At oanda.com, click on “Currency Tools” and then “FXGraph” and use the
tool to plot the last year of data for each exchange rate. Do you think the rates are
floating or fixed?
Answer: Answers will vary. The yuan per dollar exchange rate is fixed (with occa-
sional changes in value) and the euro–dollar exchange rate is floating.
3. The data in Figure 1-3 are for the year 2005. Find the IMF’s World Economic Out-
look Databases. (Hint: Google “World Economic Outlook Databases.”) Use this in-
teractive tool to obtain the latest data on current accounts in U.S. dollars for all coun-
tries (actual data or IMF estimates). Which countries had the 10 largest deficits last
year? Which countries had the 10 largest surpluses last year?
Answer: Answers will vary. As of October 25, 2010, the 10 countries with the largest
current account deficits were:
Country 2008 2009 2010
United States –668.856 –378.434 –466.513
Spain –155.962 –81.198 –71.92
Italy –78.874 –67.151 –58.272
France –54.629 –51.287 –45.743
Australia –47.477 –43.693 –29.828
Canada –6.483 –38.075 –44.245
Greece –51.212 –37.092 –33.053
India –25.48 –35.672 –44.093
Brazil –28.192 –24.302 –51.822
United Kingdom –44.063 –24.259 –50.31
S-1
,S-2 Solutions ■ Chapter 1 The Global macroeconomy
The 10 economies with the largest current account surpluses were:
Country 2008 2009 2010
Singapore 35.815 32.387 44.481
Switzerland 10.234 41.697 50.004
Korea –5.776 42.668 26.041
Netherlands 41.978 42.702 44.024
Taiwan Province of China 27.505 42.916 42.639
Russia 103.722 49.518 69.828
Norway 79.885 49.58 68.572
Japan 157.079 141.751 166.463
Germany 245.722 163.256 200.188
China 436.107 297.1 269.87
4. Figure 1-6 presents data on country risk (emerging market interest rate spreads) for
2005.Visit the Financial Times Web site (at http://www.ft.com; in the drop down list un-
der “Markets” click on “Markets Data”) to download data for country risk today. (Hint:
Google “FT high yield emerging markets.”) Which three emerging-market countries
have the highest spreads on their U.S. dollar debt? Which three have the lowest?
Answer: Answers will vary.
5. The map at the end of the chapter shows the World Bank’s composite governance in-
dicator. The World Bank has prepared other indicators to measure institutional dif-
ferences among countries. Use the Internet to find the World Bank’s “Ease of Doing
Business Map.” (Hint: Again, use Google.) Do you notice a correlation between the
ease of doing business and the overall governance indicator? Can you find countries
that rank high on the ease of doing business indicator but low on the governance in-
dicator? Are these countries rich or poor? (Hint: Look up their GNI per person at
the World Bank by googling “world bank GNI per capita.”)
Answer: There is a positive relationship between the governance quality indicators
and the ease of doing business. There are examples of countries that rank high on the
ease of business but low on governance, such as Thailand, Tonga, Mongolia, China,
Georgia, Armenia, Romania, Saudi Arabia, Peru, Belize, and Sri Lanka. Most of these
are developing, low-income countries. Saudi Arabia, ranked roughly 50th in the world
in terms of income per person, is a notable exception.
, Solutions ■ Chapter 1 The Global macroeconomy S-3
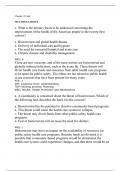
6. The following charts show the growth of real GDP per capita in three pairs of geo-
graphically adjacent countries: North and South Korea, Argentina and Chile, and
Zimbabwe and Botswana (using data from the Penn World Table).
Real GDP Real GDP Real GDP
per capita per capita per capita
$20,000 $14,000 $10,000
South Korea
18,000 9,000
12,000 Botswana
16,000 Argentina 8,000
14,000 10,000 7,000
12,000 8,000 6,000
10,000 Chile 5,000
8,000 6,000 4,000
6,000 4,000 3,000
Zimbabwe
4,000 2,000
North Korea 2,000
2,000 1,000
0 0 0
1950 1960 1970 1980 1990 2000 1950 1960 1970 1980 1990 2000 1950 1960 1970 1980 1990 2000
a. Which country in each pair experienced faster growth in GDP per capita?
Which one is now richest?
Answer: South Korea experienced faster growth than North Korea. Argentina
experienced faster growth than Chile between 1970 and 1990, but Chile’s
growth rate was higher than Argentina’s between 1990 and 2000. Botswana has
grown faster than Zimbabwe since 1970. As of 2006, the richest countries are:
South Korea, Chile, and Botswana.
b. The World Bank’s World Governance Indicators for each country in 2000 were
as follows (higher is better). Based on these data, do you think institutions can
explain the divergent outcomes in these countries? Explain. Why do you think
it helps to compare countries that are physically contiguous?
Political Stability
Control of Government and Absence Rule Regulatory Voice and
Corruption Effectiveness of Violence of Law Quality Accountability
South Korea 0.37 0.63 0.49 0.64 0.47 0.76
North Korea ⫺0.93 ⫺1.10 ⫺0.66 ⫺1.08 ⫺1.70 ⫺2.02
Chile 1.56 1.34 0.85 1.31 1.38 0.56
Argentina ⫺0.34 0.28 0.48 0.17 0.45 0.44
Botswana 1.02 0.98 0.90 0.67 0.79 0.78
Zimbabwe ⫺0.87 ⫺1.13 ⫺1.21 ⫺0.74 ⫺1.61 ⫺0.97
Answer: South Korea has consistently higher governance ratings than North
Korea. Similarly, Chile’s are higher than Argentina’s ratings, and Botswana’s are
higher than Zimbabwe’s. Based on the information for these six countries, it ap-
pears as though quality governance is associated with higher economic growth.
,