PRACTICE PAPER
GCSE
STATISTICS
Higher Tier Paper
H
1 MAY 2023
Practice paper Time allowed: 1 hour 45 minutes
Materials
For this paper you must have:
a calculator
mathematical instruments.
Instructions
Use black ink or black ball-point pen. Draw diagrams in pencil.
Fill in the boxes at the top of the page.
Answer all questions.
You must answer the questions in the spaces provided.
Do not write outside the box around each page or on blank pages.
Do all rough work in this book. Cross through any work you do
not want to be marked.
Information
The marks for questions are shown in brackets.
The maximum mark for this paper is 80.
You may ask for more answer paper and graph
paper. These must be tagged securely to this
answer book.
,GCSE STATITICS PPR1 H
Do not write
outside the
Answer all questions in the spaces box
provided.
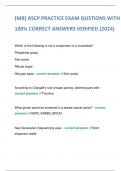
1 Here is part of an ordinal scale on a questionnaire.
Strongly Disagre X Agree Strongly
disagree e agree
□ □ □ □ □
What should the heading marked X be?
Circle your answer.
[1 mark]
Slightly agree Slightly disagree Don’t know Neutral
2 A scatter graph shows the marks of students in their Maths (x) and English
(y) exams. The equation of the line of best fit is y = 0.75x + 24.
The mean mark for the students in Maths is 60.
Circle the mean mark for students in English.
[1 mark]
24 48 60 69
8382/1
H
, 3
Do not write
outside the
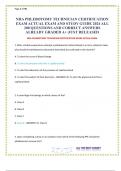
3 The Venn diagram shows information about the 500 students who study box
either full-time or part-time at a college.
In the diagram:
F represents the students who study full-time
A represents the students who study agriculture
How many students study agriculture
part-time? Circle your answer.
[1 mark]
47 11 132 179
3
4 Alexa wants to estimate the proportion of voters who support a certain
candidate in an election.
She takes a random sample of n voters.
She finds that the number of voters in this sample who support the candidate is x.
If the size of the population is N, what is the best estimate for the proportion of
voters in the population who support the candidate?
Circle your answer.
[1 mark]
x x xN
xN
n N n
Turn over for the next question
Practice Version Turn over
paper 1.0
GCSE
STATISTICS
Higher Tier Paper
H
1 MAY 2023
Practice paper Time allowed: 1 hour 45 minutes
Materials
For this paper you must have:
a calculator
mathematical instruments.
Instructions
Use black ink or black ball-point pen. Draw diagrams in pencil.
Fill in the boxes at the top of the page.
Answer all questions.
You must answer the questions in the spaces provided.
Do not write outside the box around each page or on blank pages.
Do all rough work in this book. Cross through any work you do
not want to be marked.
Information
The marks for questions are shown in brackets.
The maximum mark for this paper is 80.
You may ask for more answer paper and graph
paper. These must be tagged securely to this
answer book.
,GCSE STATITICS PPR1 H
Do not write
outside the
Answer all questions in the spaces box
provided.
1 Here is part of an ordinal scale on a questionnaire.
Strongly Disagre X Agree Strongly
disagree e agree
□ □ □ □ □
What should the heading marked X be?
Circle your answer.
[1 mark]
Slightly agree Slightly disagree Don’t know Neutral
2 A scatter graph shows the marks of students in their Maths (x) and English
(y) exams. The equation of the line of best fit is y = 0.75x + 24.
The mean mark for the students in Maths is 60.
Circle the mean mark for students in English.
[1 mark]
24 48 60 69
8382/1
H
, 3
Do not write
outside the
3 The Venn diagram shows information about the 500 students who study box
either full-time or part-time at a college.
In the diagram:
F represents the students who study full-time
A represents the students who study agriculture
How many students study agriculture
part-time? Circle your answer.
[1 mark]
47 11 132 179
3
4 Alexa wants to estimate the proportion of voters who support a certain
candidate in an election.
She takes a random sample of n voters.
She finds that the number of voters in this sample who support the candidate is x.
If the size of the population is N, what is the best estimate for the proportion of
voters in the population who support the candidate?
Circle your answer.
[1 mark]
x x xN
xN
n N n
Turn over for the next question
Practice Version Turn over
paper 1.0