SE
C
G
Geography GCSE -
ns
(Development &
io
Case Study: India)
pt
rO
te
as
M
1
, Characteristics of countries ● Developing:
○ Care for the people is low
○ Lack of infrastructure; buildings, roads
○ Short life expectancy
○ High birth rate
○ Low access to education
○ Lack of necessary resources
○ rural ; isolated communities
○ Overcrowded cities
■ E.g Nepal, Haiti, Cuba,
Malawi, Bangladesh
SE
● Emerging:
○ Offer better education
○ More variety of jobs
○ Improved life expectancy
○ Economy will grow and improve
○ Has evidence of inequality and poverty
○ More infrastructure
○ More luxuries
C
○ Not as good as developed
■ E.g Brazil, Russia, India,
China, South Africa (BRICS)
● Developed:
○ More care for people
G
○ Better healthcare
○ Suitable housing for families and people
○ Less poverty
○ Low birth rate
○ High life expectancy
ns ○
○
○
○
○
Low death rate
Access to good education
Access to jobs
High GDP
More luxuries
■ E.g France, Spain, Singapore,
io
England, Australia, Canada
Development indicators: ● GDP = Gross Domestic Product (per capita)
● Death rate
pt
○ The total value of goods and services
● Quality of life made by a country in a year per head
● People per doctor
population
● Life expectancy
● Literacy rate ● GNI = Gross National Income
● Clean water ○ How much income the country has
rO
made in a year
● CPI = Corruptions Perceptions Index
○ Measures how safe from corruption that
countries are perceived to be
○ 10 (honest), 0 (very corrupt)
● HDI = Human Development Index
te
○ This is a combination of several different
measurements put together. It produces
a score of between 0 to 1. The closer to
1, the better.
as
○ Includes:
■ GNI (if not GDP per capita)
■ Life expectancy
■ Years of schooling (if not
Literacy rate)
● Birth Rate = number of live births per 1,000 of the
M
population per year
● Death Rate = number of deaths per 1,000 of the
population per year
● Fertility Rate = the average number of babies
born to each woman
● Infant mortality = the death of an infant before hir
or her first birthday - the number of infant deaths
for every 1,000 live births
2
, ● Maternal mortality = number of mothers that die
during childbirth (before per 1,000 per year).
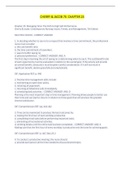
Population pyramids
● A diagram that shows the proportions of men and
women in each age group in a country’s
population
○ Youth (0-15 years)
○ Economically active (16-64 years)
○ Aged (65+ years)
SE
C
G
ns
io
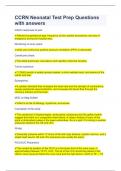
● Developed country population pyramid
○ High life expectancy
○ In migration workers (people migrate
here)
pt
○ Large economically active
○ Narrow base
○ Low birth rate
○ Low fertility rate
○ Consistent bars
rO
○ Low death rate
○ Broad top
te
as
M
● Developing country population pyramid
○ High birth rate
3
C
G
Geography GCSE -
ns
(Development &
io
Case Study: India)
pt
rO
te
as
M
1
, Characteristics of countries ● Developing:
○ Care for the people is low
○ Lack of infrastructure; buildings, roads
○ Short life expectancy
○ High birth rate
○ Low access to education
○ Lack of necessary resources
○ rural ; isolated communities
○ Overcrowded cities
■ E.g Nepal, Haiti, Cuba,
Malawi, Bangladesh
SE
● Emerging:
○ Offer better education
○ More variety of jobs
○ Improved life expectancy
○ Economy will grow and improve
○ Has evidence of inequality and poverty
○ More infrastructure
○ More luxuries
C
○ Not as good as developed
■ E.g Brazil, Russia, India,
China, South Africa (BRICS)
● Developed:
○ More care for people
G
○ Better healthcare
○ Suitable housing for families and people
○ Less poverty
○ Low birth rate
○ High life expectancy
ns ○
○
○
○
○
Low death rate
Access to good education
Access to jobs
High GDP
More luxuries
■ E.g France, Spain, Singapore,
io
England, Australia, Canada
Development indicators: ● GDP = Gross Domestic Product (per capita)
● Death rate
pt
○ The total value of goods and services
● Quality of life made by a country in a year per head
● People per doctor
population
● Life expectancy
● Literacy rate ● GNI = Gross National Income
● Clean water ○ How much income the country has
rO
made in a year
● CPI = Corruptions Perceptions Index
○ Measures how safe from corruption that
countries are perceived to be
○ 10 (honest), 0 (very corrupt)
● HDI = Human Development Index
te
○ This is a combination of several different
measurements put together. It produces
a score of between 0 to 1. The closer to
1, the better.
as
○ Includes:
■ GNI (if not GDP per capita)
■ Life expectancy
■ Years of schooling (if not
Literacy rate)
● Birth Rate = number of live births per 1,000 of the
M
population per year
● Death Rate = number of deaths per 1,000 of the
population per year
● Fertility Rate = the average number of babies
born to each woman
● Infant mortality = the death of an infant before hir
or her first birthday - the number of infant deaths
for every 1,000 live births
2
, ● Maternal mortality = number of mothers that die
during childbirth (before per 1,000 per year).
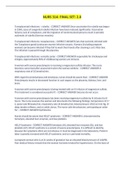
Population pyramids
● A diagram that shows the proportions of men and
women in each age group in a country’s
population
○ Youth (0-15 years)
○ Economically active (16-64 years)
○ Aged (65+ years)
SE
C
G
ns
io
● Developed country population pyramid
○ High life expectancy
○ In migration workers (people migrate
here)
pt
○ Large economically active
○ Narrow base
○ Low birth rate
○ Low fertility rate
○ Consistent bars
rO
○ Low death rate
○ Broad top
te
as
M
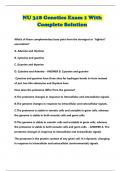
● Developing country population pyramid
○ High birth rate
3