Lecture 1
Statistics: The study of how we describe and make inferences form data
• An inference is a conclusion reached on the basis of evidence and reasoning
• Distinction between descriptive and inferential statistics
Types of statistics
Univariate: one variable of things
Bivariate: using two variables to come to conclusion
Multivariate: multiple variables to come to conclusion
Population symbol - N
Sample symbol - n
Descriptive statistics: describing the sample, not the population.
Inferential statistics: When you want measurement on the sample, make statement about
population you use inferental statistics
Units of analysis & variables
Units of analysis: the what or who is being studied
• The unit that you will be able to draw conclusion about
• Typically, all units are the same type of thing in single data set
• E.g. individuals, families, countries, companies, etc.
Variables: a ,measure property of each of the units of analysis
• E.g. age, GDP, household, income, annual revenue.
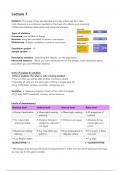
Levels of measurement
Nominal level Ordinal level Interval level Ratio level
• Group classification • Meaningful ranking • Meaningful ranking • All properties of
ordering interval
• No meaningful • Distance between • Distance are equal • Absolute & has
ranking possible categories unknown/ meaningful zero
not equal point
• Numerical coding • E.g. how often you • E.g. temperature in • If it is zero, it does
arbitrary watch tv degrees celsius not exist
• E.g. Reglion types • E.g. Age
QUALITATIVE—> <—QUANTITATIVE
* We always need to know the level of measurement in order to know which statistical technique
we may use for the given variable
,Continuous vs discrete variables
Continuous variable is measured along a continuum
Discrete variable is measured in whole units or categories.
Example:
• A person’s height - continuous
• A persons number of children - discrete
• Number of doctors in country - discrete
• Surface area (km) of a country - continuous
• Average number of children per woman in a country - continuous
Measures of central tendency & measures of variability
To (univariately) describe the distribution of variables on different levels of measurement
The mean
• Is for ➔ Interval/ratio
• Sample Mean symbol - M
• Changing any score will change mean
• Adding or removing a score will change mean (unless that score is already equal to mean)
• Adding, subtracting, multiplying, dividing each score by a given value (a “constant”) causes the
mean to change accordingly
• Sum differences from the mean is zero
• Sum of squared differences from the mean is minimal
• can only be used for interval/ratio variables
• most useful for describing (more or less) normally distributed variables
The median
• can be used for ordinal or interval/ratio variables
• often used for interval/ratio variables that have skewed distributions
• Ordinal, interval, ratio
,• Median is not as sensitive to outliers as the mean
• Also called 50th percentile
• Whenever n is an even number, the median is the mean value of the two middle cases
• To determine the median from a frequency table, we need to identify the first category that
exceeds 50% in the ‘cumulative percent’ column
• Cummulative percentage is used to find median
The mode
• can be used for nominal, ordinal or interval/ratio variables
• Nominal, ordinal,interval/ ratio
• The mode is the category with the largest amount of cases
Normal/skewed distribution
Tutorial SPSS 1
Data view: one column is one variable, one row is one person
Variable view: each row is one variable, and each column is one property of that variable.
- Variables name do not have space in between them
- Label you write down what you have originally asked in questionnaire or what you mean with
that variable
- Label values box you put in the answers people can ultimately choose “1.00 = never watched”
- In Measure box you put in your level of measurement “Scale = Ratio/interval”
- In Nominal measurement there is no mean or median
Analyzing Data
- Click analyze (top of the window) – and then descriptive statistics and then frequencies and
then the type of chart you will like
- All the variable son the right side are the variables hat spss will analyze
- When saying modes, you use “the labels you gave” instead of “the code number you gave it”
- In cumulative percentage if its above 50%
- Valid percent exclude the missing, the percent includes it
Analyzing on Case
- Click on data, then select cases, click on if, click variable, and type in value you want to check
exclusively. So here you check only males, females, or only country, etc.
, Lecture 2
Measure of variability
Measures of central tendency alone carry not enough information to adequately describe
distributions of variables, we need a second type of measures: Measuring variability
Different type of variables are called Dispersion/Variability
The Range: The distance between highest to lowest.
- can be calculated for ordinal, interval, ratio
- Always reported together with maximum and minimum score
- Is sensitive to outliers
Interquartile range (IQR)
- Based on “quartiles” that split our data into four equal groups of cases
- IQR based on distance between Q1 and Q3
The variance
Is based on the Sum of Squares, is the squared distance from the mean. For the calculation
of the variance, it matters whether we have sample data or population data.
How can we interpret the value of the variance?
• We don’t, but: “everything is meaningful in comparison” (i.e. when comparing variances across
groups, we can make comparative statements about more/less dispersion around the mean)
• For the purpose of interpretation, we calculate another measure of variability: the standard
deviation
Why are there two different variance formulas for sample data / population data?
• We often use the sample variance as an ‘estimator’ for the population variance (which is typically
unknown)
• When we calculate sample variance, we therefore divide by n-1, to arrive at an unbiased
estimator of the population variance
• Note how this is particularly relevant in small samples
What is the difference between the de nitional and the computational formula of the
variance?
• Different formulas for calculating the same thing (we use definitional formula)
• Advantage of computational formula: no need to calculate individual distances from
the mean
fi
Statistics: The study of how we describe and make inferences form data
• An inference is a conclusion reached on the basis of evidence and reasoning
• Distinction between descriptive and inferential statistics
Types of statistics
Univariate: one variable of things
Bivariate: using two variables to come to conclusion
Multivariate: multiple variables to come to conclusion
Population symbol - N
Sample symbol - n
Descriptive statistics: describing the sample, not the population.
Inferential statistics: When you want measurement on the sample, make statement about
population you use inferental statistics
Units of analysis & variables
Units of analysis: the what or who is being studied
• The unit that you will be able to draw conclusion about
• Typically, all units are the same type of thing in single data set
• E.g. individuals, families, countries, companies, etc.
Variables: a ,measure property of each of the units of analysis
• E.g. age, GDP, household, income, annual revenue.
Levels of measurement
Nominal level Ordinal level Interval level Ratio level
• Group classification • Meaningful ranking • Meaningful ranking • All properties of
ordering interval
• No meaningful • Distance between • Distance are equal • Absolute & has
ranking possible categories unknown/ meaningful zero
not equal point
• Numerical coding • E.g. how often you • E.g. temperature in • If it is zero, it does
arbitrary watch tv degrees celsius not exist
• E.g. Reglion types • E.g. Age
QUALITATIVE—> <—QUANTITATIVE
* We always need to know the level of measurement in order to know which statistical technique
we may use for the given variable
,Continuous vs discrete variables
Continuous variable is measured along a continuum
Discrete variable is measured in whole units or categories.
Example:
• A person’s height - continuous
• A persons number of children - discrete
• Number of doctors in country - discrete
• Surface area (km) of a country - continuous
• Average number of children per woman in a country - continuous
Measures of central tendency & measures of variability
To (univariately) describe the distribution of variables on different levels of measurement
The mean
• Is for ➔ Interval/ratio
• Sample Mean symbol - M
• Changing any score will change mean
• Adding or removing a score will change mean (unless that score is already equal to mean)
• Adding, subtracting, multiplying, dividing each score by a given value (a “constant”) causes the
mean to change accordingly
• Sum differences from the mean is zero
• Sum of squared differences from the mean is minimal
• can only be used for interval/ratio variables
• most useful for describing (more or less) normally distributed variables
The median
• can be used for ordinal or interval/ratio variables
• often used for interval/ratio variables that have skewed distributions
• Ordinal, interval, ratio
,• Median is not as sensitive to outliers as the mean
• Also called 50th percentile
• Whenever n is an even number, the median is the mean value of the two middle cases
• To determine the median from a frequency table, we need to identify the first category that
exceeds 50% in the ‘cumulative percent’ column
• Cummulative percentage is used to find median
The mode
• can be used for nominal, ordinal or interval/ratio variables
• Nominal, ordinal,interval/ ratio
• The mode is the category with the largest amount of cases
Normal/skewed distribution
Tutorial SPSS 1
Data view: one column is one variable, one row is one person
Variable view: each row is one variable, and each column is one property of that variable.
- Variables name do not have space in between them
- Label you write down what you have originally asked in questionnaire or what you mean with
that variable
- Label values box you put in the answers people can ultimately choose “1.00 = never watched”
- In Measure box you put in your level of measurement “Scale = Ratio/interval”
- In Nominal measurement there is no mean or median
Analyzing Data
- Click analyze (top of the window) – and then descriptive statistics and then frequencies and
then the type of chart you will like
- All the variable son the right side are the variables hat spss will analyze
- When saying modes, you use “the labels you gave” instead of “the code number you gave it”
- In cumulative percentage if its above 50%
- Valid percent exclude the missing, the percent includes it
Analyzing on Case
- Click on data, then select cases, click on if, click variable, and type in value you want to check
exclusively. So here you check only males, females, or only country, etc.
, Lecture 2
Measure of variability
Measures of central tendency alone carry not enough information to adequately describe
distributions of variables, we need a second type of measures: Measuring variability
Different type of variables are called Dispersion/Variability
The Range: The distance between highest to lowest.
- can be calculated for ordinal, interval, ratio
- Always reported together with maximum and minimum score
- Is sensitive to outliers
Interquartile range (IQR)
- Based on “quartiles” that split our data into four equal groups of cases
- IQR based on distance between Q1 and Q3
The variance
Is based on the Sum of Squares, is the squared distance from the mean. For the calculation
of the variance, it matters whether we have sample data or population data.
How can we interpret the value of the variance?
• We don’t, but: “everything is meaningful in comparison” (i.e. when comparing variances across
groups, we can make comparative statements about more/less dispersion around the mean)
• For the purpose of interpretation, we calculate another measure of variability: the standard
deviation
Why are there two different variance formulas for sample data / population data?
• We often use the sample variance as an ‘estimator’ for the population variance (which is typically
unknown)
• When we calculate sample variance, we therefore divide by n-1, to arrive at an unbiased
estimator of the population variance
• Note how this is particularly relevant in small samples
What is the difference between the de nitional and the computational formula of the
variance?
• Different formulas for calculating the same thing (we use definitional formula)
• Advantage of computational formula: no need to calculate individual distances from
the mean
fi