ECS1501
ASSIGNMENT
5 OF
SEMESTER 1
2023
1
, Dashboard Calendar
Dashboard / My courses / ECS1501-23-S1 / Assessments / Assessment 5
Started on Wednesday, 26 April 2023, 8:43 AM
State Finished
Completed on Wednesday, 26 April 2023, 9:19 AM
Time taken 36 mins 12 secs
Marks 15.00/15.00
Grade 100.00 out of 100.00
Question1
Complete
I confirm
Not graded
that this assessment will be my own individual work;
that I will not communicate with anyone else in any way during the completion of this assessment;
that I will not cheat in any way in completing and submitting this assessment.
I confirm.
I do not confirm.
,Question2
Complete
Suppose we observe that the equilibrium quantity of a particular good has increased significantly over the past 5 years, with virtually no change in the equilibrium price. The most
Mark 1.00 out of
likely explanation is that, over the past 5 years, both supply and demand have increased.
1.00
Dashboard Calendar
Note, that you will lose 50% of the mark for this question if you choose the incorrect option.
If you are not sure about the answer and do not want to guess, choose the “Unsure” option. You will neither receive marks for the question nor will you lose marks for choosing this
Dashboard / My courses / ECS1501-23-S1 / Assessments / Assessment 5
option.
True
False
Unsure
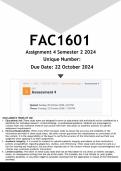
An increase in demand is shown by a rightward shift of the demand curve leading to an increase in the equilibrium price and the equilibrium quantity.
The increase in supply leads to a rightward shift of the supply curve and the equilibrium price decreases and the equilibrium quantity increases.
Thus, the equilibrium price can either increase, decrease or stay the same (see diagram below) while the equilibrium quantity will increase.
, Question3
Complete
If demand for a particular good increase at the same time that supply decreases, the effect on equilibrium price will be a decrease.
Mark 1.00 out of
1.00
Note, that you will lose 50% of the mark for this question if you choose the incorrect option.
Dashboard Calendar
If you are not sure about the answer and do not want to guess, choose the “Unsure” option. You will neither receive marks for the question nor will you lose marks for choosing this
option.
Dashboard / My courses / ECS1501-23-S1 / Assessments / Assessment 5
True
False
Unsure
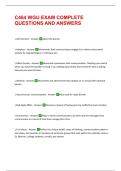
The increase in demand is shown by a rightward shift of the demand curve leading to an increase in the equilibrium price and the equilibrium quantity.
The decrease in the supply can be shown by a leftward shift of the supply curve. The equilibrium price increases while the equilibrium quantity decreases.
Thus, the equilibrium price will increase.
ASSIGNMENT
5 OF
SEMESTER 1
2023
1
, Dashboard Calendar
Dashboard / My courses / ECS1501-23-S1 / Assessments / Assessment 5
Started on Wednesday, 26 April 2023, 8:43 AM
State Finished
Completed on Wednesday, 26 April 2023, 9:19 AM
Time taken 36 mins 12 secs
Marks 15.00/15.00
Grade 100.00 out of 100.00
Question1
Complete
I confirm
Not graded
that this assessment will be my own individual work;
that I will not communicate with anyone else in any way during the completion of this assessment;
that I will not cheat in any way in completing and submitting this assessment.
I confirm.
I do not confirm.
,Question2
Complete
Suppose we observe that the equilibrium quantity of a particular good has increased significantly over the past 5 years, with virtually no change in the equilibrium price. The most
Mark 1.00 out of
likely explanation is that, over the past 5 years, both supply and demand have increased.
1.00
Dashboard Calendar
Note, that you will lose 50% of the mark for this question if you choose the incorrect option.
If you are not sure about the answer and do not want to guess, choose the “Unsure” option. You will neither receive marks for the question nor will you lose marks for choosing this
Dashboard / My courses / ECS1501-23-S1 / Assessments / Assessment 5
option.
True
False
Unsure
An increase in demand is shown by a rightward shift of the demand curve leading to an increase in the equilibrium price and the equilibrium quantity.
The increase in supply leads to a rightward shift of the supply curve and the equilibrium price decreases and the equilibrium quantity increases.
Thus, the equilibrium price can either increase, decrease or stay the same (see diagram below) while the equilibrium quantity will increase.
, Question3
Complete
If demand for a particular good increase at the same time that supply decreases, the effect on equilibrium price will be a decrease.
Mark 1.00 out of
1.00
Note, that you will lose 50% of the mark for this question if you choose the incorrect option.
Dashboard Calendar
If you are not sure about the answer and do not want to guess, choose the “Unsure” option. You will neither receive marks for the question nor will you lose marks for choosing this
option.
Dashboard / My courses / ECS1501-23-S1 / Assessments / Assessment 5
True
False
Unsure
The increase in demand is shown by a rightward shift of the demand curve leading to an increase in the equilibrium price and the equilibrium quantity.
The decrease in the supply can be shown by a leftward shift of the supply curve. The equilibrium price increases while the equilibrium quantity decreases.
Thus, the equilibrium price will increase.