Factor analysis.
multiple regression always postulates that one variable is dependent on other variables (add
this to multiple regression)>
wish to reduce the complexity of our problem by reducing the number of variables being
studied
Factor analysis has two main goals: 1. Data reduction 2. Detection of structure
e two main classes of factor analysis: confirmatory factor analysis (CFA) and exploratory factor
analysis (EFA).
Factor analysis assumes that the variables we measure are often manifestations of deeper,
underlying (or ‘latent’) variables.
Latent variables generate or produce manifest variables, which are things we can observe and
measure.
Another name for ‘latent variable’ is ‘factor’.
A factor (or latent variable) is a hypothetical construct that generates (or represents) a set of
observed variables.
A factor loading can be thought of as the correlation of an observed variable with a factor
two main aims of factor analysis:
1. A desire to reduce complexity by reducing the number of variables in an analysis
2. A desire to find structure in the world by identifying the latent variables that underlie
observed data.
frequently used kinds of factor analysis under EFA (exploratory factor analysis) are principal
component analysis (PCA) and principal factor analysis (PFA).
PCA seeks a convenient, smaller set of basis variables, and PFA seeks an underlying, meaningful
structure
When we combine a few similar factors into 1 construct, we lose the variance (less in the
dataset I guess)
Its okay to lose some variance as long as its small.
component extraction in a PCA proceeds by extracting eigenvectors (or components) that
resolve maximal variance.
Analyse | Dimension Reduction | Factor – choose variables.
We need to decide how many values we want to retain or combine, based on how much
variance we losing.
Two frequently used rules of thumb are the Kaiser eigenvalue rule and the Cattell scree-plot
rule.
Kaiser eigenvalue rule encourages the acceptance of only those components with an
eigenvalue greater than 1.
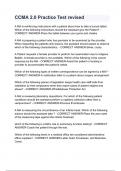
the scree-plot rule, a line plot is drawn of the eigenvalues and arranged in descending order.
high eigenvalues representing the peak, and the low values the scree
where the slope descends into the scree is where the components stop being interpretable
and should be rejected
scree plot is under display for when doing factor analysis/
A newer method of deciding how many components to extract in a PCA is Horn’s parallel
analysis. Generate some fake correlations and get eigenvalues for them. Its nonsense data.
If an eigenvalue from our data is greater than the corresponding eigenvalue from the random,
uncorrelated data, we can conclude that there is a ‘true’ component explaining the variance in
the variables.
multiple regression always postulates that one variable is dependent on other variables (add
this to multiple regression)>
wish to reduce the complexity of our problem by reducing the number of variables being
studied
Factor analysis has two main goals: 1. Data reduction 2. Detection of structure
e two main classes of factor analysis: confirmatory factor analysis (CFA) and exploratory factor
analysis (EFA).
Factor analysis assumes that the variables we measure are often manifestations of deeper,
underlying (or ‘latent’) variables.
Latent variables generate or produce manifest variables, which are things we can observe and
measure.
Another name for ‘latent variable’ is ‘factor’.
A factor (or latent variable) is a hypothetical construct that generates (or represents) a set of
observed variables.
A factor loading can be thought of as the correlation of an observed variable with a factor
two main aims of factor analysis:
1. A desire to reduce complexity by reducing the number of variables in an analysis
2. A desire to find structure in the world by identifying the latent variables that underlie
observed data.
frequently used kinds of factor analysis under EFA (exploratory factor analysis) are principal
component analysis (PCA) and principal factor analysis (PFA).
PCA seeks a convenient, smaller set of basis variables, and PFA seeks an underlying, meaningful
structure
When we combine a few similar factors into 1 construct, we lose the variance (less in the
dataset I guess)
Its okay to lose some variance as long as its small.
component extraction in a PCA proceeds by extracting eigenvectors (or components) that
resolve maximal variance.
Analyse | Dimension Reduction | Factor – choose variables.
We need to decide how many values we want to retain or combine, based on how much
variance we losing.
Two frequently used rules of thumb are the Kaiser eigenvalue rule and the Cattell scree-plot
rule.
Kaiser eigenvalue rule encourages the acceptance of only those components with an
eigenvalue greater than 1.
the scree-plot rule, a line plot is drawn of the eigenvalues and arranged in descending order.
high eigenvalues representing the peak, and the low values the scree
where the slope descends into the scree is where the components stop being interpretable
and should be rejected
scree plot is under display for when doing factor analysis/
A newer method of deciding how many components to extract in a PCA is Horn’s parallel
analysis. Generate some fake correlations and get eigenvalues for them. Its nonsense data.
If an eigenvalue from our data is greater than the corresponding eigenvalue from the random,
uncorrelated data, we can conclude that there is a ‘true’ component explaining the variance in
the variables.