Electrocardiography
The electrocardiogram (ECG) is an integral component of the evaluation of
the cardiovascular system. It should be seen as part of a physical
examination rather than a special investigation. Every general practitioner
must have access to an ECG machine when evaluating patients for symptoms
such as chest pain, shortness of breath, palpitations, syncope, insurance
examinations, etc. Understanding the scientific basis for the ECG and
mastering the art of ECG interpretation is within everyone’s grasp, provided
one invests the time and effort to study every ECG available. Providing
yourself with the knowledge and skill to accurately interpret ECGs is a
prerequisite for becoming a good doctor. Enjoy this next step in your
development towards that goal.
Basic principles:
The ECG records the electrical activity of the heart at the surface of the body
as described in the beginning of the 20th century by Einthoven. By recording
this electrical activity over time, Einthoven succeeded in monitoring the
spread of depolarisation and repolarisation through the heart with every
heartbeat. At cellular level each myocardial cell has a negative intra-cellular
charge of –90 millivolt compared to the extra-cellular space. This diastolic
voltage difference (phase 4) is maintained by the impermeability of the cell
membrane to sodium and the activity of ion pumps such as the sodium
potassium pump. When an electrical impulse reaches the cell, depolarisation
occurs due to a sudden increase in the permeability of the membrane to
sodium causing an influx of sodium into the cell with the loss of the negative
resting potential (phase 0). During repolarisation the cellular electrolyte
balance and intracellular charge is restored (phases 1, 2 and 3 involving
fluxes of potassium and calcium in addition to the sodium flux).
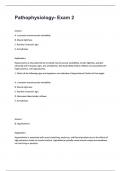
Figure 1.
Phase 0 Na+ channels open
1 Na+ channels close
2 Ca++ channels open;
fast K+ channels close
3 Ca++ channels close;
slow K+ channels open
4 Resting potential
,The electrocardiogram records the size and direction of the electrical impulse
generated in the heart.
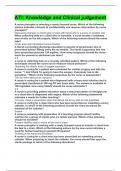
Figure 2. An impulse moving towards an
electrode results in a positive deflection.
An impulse moving away from an
electrode results in a negative deflection.
An impulse moving at right angles to an
electrode i.e. approaching the electrode
until it is level and then moving away
from the electrode, will be reflected by a
positive followed by a negative deflection
(a biphasic deflection).
Figure 3. If an electrical
impulse moves at an angle to
an electrode the size of the
deflection at that electrode is
determined by the resultant
vector.
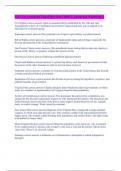
To function effectively as a pump, depolarisation of the myocardium must
proceed in a coordinated fashion. This is achieved by distribution of the
electrical activities through the heart by way of specialised conductive tissue
(Figure 4) and the syncytial nature of the myocardial cells. The impulse for
each cardiac cycle has its origin in the sinoatrial node (SA node) in the right
atrium leading to depolarisation of both atria (first right then left) representing
the P-wave on the ECG. On reaching the atrio-ventricular node (AV node) the
impulse is delayed before activating the ventricles. This is reflected by the
iso-electric segment between the P wave and QRS complex. The impulse is
then rapidly distributed through the bundle of His and the two bundle-
branches to the network of Purkinje fibres supplying the myocardium. The
bundle-branches consist of the right bundle-branch and the left-bundle branch
(divided into two fascicles, the antero-lateral fascicle and the infero-posterior
fascicle).
2
,Figure 4.
The depolarisation of the myocardium is Figure 5.
reflected on the ECG by the QRS complex. Per
convention three types of deflections are
recognized (figure 5). An initial negative
deflection (not preceded by a positive
deflection) is known as a Q-wave. A negative
deflection following a positive deflection is
known as a S-wave. All positive deflections are
known as R-waves.
Atrial depolarisation is represented by the P
wave. Atrial repolarisation is not seen on the
surface ECG as this deflection is masked by the
overlying QRS complex. Ventricular
repolarisation is represented by the T-wave. The direction of the T-wave
normally follows the mean vector of the QRS complex. An additional
deflection following the T-wave is sometimes seen. The exact origin of this
wave, known as the U-wave, is obscure.
Consider now the deflections recorded by an electrode at the dot adjacent to
the left ventricle in the accompanying diagram (Figure 6a). The electrode
position (A) corresponds to leads V5 or V6 of the 12 lead ECG – see later.
Atrial depolarisation is recorded as a positive deflection as the resultant vector
of atrial depolarisation is towards electrode A. Impulse delay in the AV node
causes the iso-electric segment between the P wave and the QRS complex.
The first component of the myocardium to depolarise is the interventricular
septum, which is depolarised from left to right. The resultant vector is
therefore away from the electrode causing a negative deflection (Q wave). As
the impulse is then conducted to the thick left ventricular free wall (towards
the electrode) a large positive vector is registered at the electrode resulting in
a tall R wave. The remote sections of the right ventricular is depolarised
3
, slightly later giving a resultant vector away from the electrode, therefore a S
wave.
Figure 6a.
1. 2.
3. 4.
If we record the same Figure 6b.
electrical activity from
an electrode (B) placed
at the position of V1 on
the 12 lead ECG, i.e.
over the right ventricle,
the QRS complex will be
registered as follows:
The first deflection of
the QRS complex
representing septal
depolarisation from left
to right is towards the
electrode, therefore resulting in a small R wave. The left ventricular
depolarisation that follows is away from this electrode resulting in a negative S
wave. The depolarisation of the right ventricular wall is once again in the
direction of the electrode and would therefore record a positive deflection or
R wave.
4
The electrocardiogram (ECG) is an integral component of the evaluation of
the cardiovascular system. It should be seen as part of a physical
examination rather than a special investigation. Every general practitioner
must have access to an ECG machine when evaluating patients for symptoms
such as chest pain, shortness of breath, palpitations, syncope, insurance
examinations, etc. Understanding the scientific basis for the ECG and
mastering the art of ECG interpretation is within everyone’s grasp, provided
one invests the time and effort to study every ECG available. Providing
yourself with the knowledge and skill to accurately interpret ECGs is a
prerequisite for becoming a good doctor. Enjoy this next step in your
development towards that goal.
Basic principles:
The ECG records the electrical activity of the heart at the surface of the body
as described in the beginning of the 20th century by Einthoven. By recording
this electrical activity over time, Einthoven succeeded in monitoring the
spread of depolarisation and repolarisation through the heart with every
heartbeat. At cellular level each myocardial cell has a negative intra-cellular
charge of –90 millivolt compared to the extra-cellular space. This diastolic
voltage difference (phase 4) is maintained by the impermeability of the cell
membrane to sodium and the activity of ion pumps such as the sodium
potassium pump. When an electrical impulse reaches the cell, depolarisation
occurs due to a sudden increase in the permeability of the membrane to
sodium causing an influx of sodium into the cell with the loss of the negative
resting potential (phase 0). During repolarisation the cellular electrolyte
balance and intracellular charge is restored (phases 1, 2 and 3 involving
fluxes of potassium and calcium in addition to the sodium flux).
Figure 1.
Phase 0 Na+ channels open
1 Na+ channels close
2 Ca++ channels open;
fast K+ channels close
3 Ca++ channels close;
slow K+ channels open
4 Resting potential
,The electrocardiogram records the size and direction of the electrical impulse
generated in the heart.
Figure 2. An impulse moving towards an
electrode results in a positive deflection.
An impulse moving away from an
electrode results in a negative deflection.
An impulse moving at right angles to an
electrode i.e. approaching the electrode
until it is level and then moving away
from the electrode, will be reflected by a
positive followed by a negative deflection
(a biphasic deflection).
Figure 3. If an electrical
impulse moves at an angle to
an electrode the size of the
deflection at that electrode is
determined by the resultant
vector.
To function effectively as a pump, depolarisation of the myocardium must
proceed in a coordinated fashion. This is achieved by distribution of the
electrical activities through the heart by way of specialised conductive tissue
(Figure 4) and the syncytial nature of the myocardial cells. The impulse for
each cardiac cycle has its origin in the sinoatrial node (SA node) in the right
atrium leading to depolarisation of both atria (first right then left) representing
the P-wave on the ECG. On reaching the atrio-ventricular node (AV node) the
impulse is delayed before activating the ventricles. This is reflected by the
iso-electric segment between the P wave and QRS complex. The impulse is
then rapidly distributed through the bundle of His and the two bundle-
branches to the network of Purkinje fibres supplying the myocardium. The
bundle-branches consist of the right bundle-branch and the left-bundle branch
(divided into two fascicles, the antero-lateral fascicle and the infero-posterior
fascicle).
2
,Figure 4.
The depolarisation of the myocardium is Figure 5.
reflected on the ECG by the QRS complex. Per
convention three types of deflections are
recognized (figure 5). An initial negative
deflection (not preceded by a positive
deflection) is known as a Q-wave. A negative
deflection following a positive deflection is
known as a S-wave. All positive deflections are
known as R-waves.
Atrial depolarisation is represented by the P
wave. Atrial repolarisation is not seen on the
surface ECG as this deflection is masked by the
overlying QRS complex. Ventricular
repolarisation is represented by the T-wave. The direction of the T-wave
normally follows the mean vector of the QRS complex. An additional
deflection following the T-wave is sometimes seen. The exact origin of this
wave, known as the U-wave, is obscure.
Consider now the deflections recorded by an electrode at the dot adjacent to
the left ventricle in the accompanying diagram (Figure 6a). The electrode
position (A) corresponds to leads V5 or V6 of the 12 lead ECG – see later.
Atrial depolarisation is recorded as a positive deflection as the resultant vector
of atrial depolarisation is towards electrode A. Impulse delay in the AV node
causes the iso-electric segment between the P wave and the QRS complex.
The first component of the myocardium to depolarise is the interventricular
septum, which is depolarised from left to right. The resultant vector is
therefore away from the electrode causing a negative deflection (Q wave). As
the impulse is then conducted to the thick left ventricular free wall (towards
the electrode) a large positive vector is registered at the electrode resulting in
a tall R wave. The remote sections of the right ventricular is depolarised
3
, slightly later giving a resultant vector away from the electrode, therefore a S
wave.
Figure 6a.
1. 2.
3. 4.
If we record the same Figure 6b.
electrical activity from
an electrode (B) placed
at the position of V1 on
the 12 lead ECG, i.e.
over the right ventricle,
the QRS complex will be
registered as follows:
The first deflection of
the QRS complex
representing septal
depolarisation from left
to right is towards the
electrode, therefore resulting in a small R wave. The left ventricular
depolarisation that follows is away from this electrode resulting in a negative S
wave. The depolarisation of the right ventricular wall is once again in the
direction of the electrode and would therefore record a positive deflection or
R wave.
4