Standard Deviation Notes
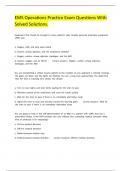
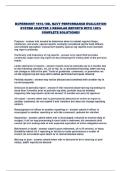
- Standard deviation
calculated with the mean
can tell you how spread
out data is.
- Can be calculated with
spreadsheet, calculator,
or math equation.
1. Calculate mean
2. Subtract the mean
from each data point
3. Square each
difference
4. Calculate the mean of
the squared
differences
5. Take the square root.
- Lower case sigma stands for standard deviation of a population. Upper case sigma
tells us to calculate the sum for each instance. X is each data point. X bar is the
mean of the data points. And n is the number of data points.
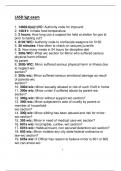
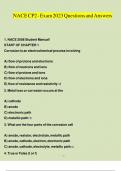
The Normal distribution
- Data from a population or sample
- Parameter: a number that describes data from a population
- Statistic: a number that describes data from a sample
- Mean + Standard Deviation.
Sample Population
Mean -Over X Greek letter
Standard s Greek letter
Deviation
Type Statistic Parameter
Graph Characterizes the spread of the Characterizes the position
normal distribution. Larger the of the normal distribution.
standard deviation (), flatter the Curve always follows the
curve will be, smaller the standard mean ()
deviation (), taller the curve will
be.
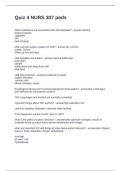
- A special type of bell curve shaped bell/normal curve
- Tendency for data to cluster around central value (mean)
- Weight, height, volume etc.
- Exam scores follow normal distribution.
- The normal distribution is unimodal (single peak)
- The normal curve is symmetric about its mean (middle is tallest)
- The parameters and completely characterize the normal distribution
- X ~ N (, ) (variable x has a normal distribution with a mean miu and standard
deviation of sigma)
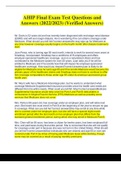
- Standard deviation
calculated with the mean
can tell you how spread
out data is.
- Can be calculated with
spreadsheet, calculator,
or math equation.
1. Calculate mean
2. Subtract the mean
from each data point
3. Square each
difference
4. Calculate the mean of
the squared
differences
5. Take the square root.
- Lower case sigma stands for standard deviation of a population. Upper case sigma
tells us to calculate the sum for each instance. X is each data point. X bar is the
mean of the data points. And n is the number of data points.
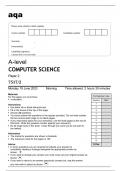
The Normal distribution
- Data from a population or sample
- Parameter: a number that describes data from a population
- Statistic: a number that describes data from a sample
- Mean + Standard Deviation.
Sample Population
Mean -Over X Greek letter
Standard s Greek letter
Deviation
Type Statistic Parameter
Graph Characterizes the spread of the Characterizes the position
normal distribution. Larger the of the normal distribution.
standard deviation (), flatter the Curve always follows the
curve will be, smaller the standard mean ()
deviation (), taller the curve will
be.
- A special type of bell curve shaped bell/normal curve
- Tendency for data to cluster around central value (mean)
- Weight, height, volume etc.
- Exam scores follow normal distribution.
- The normal distribution is unimodal (single peak)
- The normal curve is symmetric about its mean (middle is tallest)
- The parameters and completely characterize the normal distribution
- X ~ N (, ) (variable x has a normal distribution with a mean miu and standard
deviation of sigma)