STAT 361 Data Analysis - Yale University WORKSHEET 3.7: STATISTICAL THINKING IN PYTHON
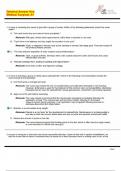
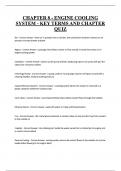
STAT 361 Data Analysis - Yale University WORKSHEET 3.7: STATISTICAL THINKING IN PYTHONWrite codes in Jupyter as required by the problems. Copy the code and output (as screen grab or screen shot) and p aste them here. 1 Date: Which of the following conclusions could you draw from the following bee swarm plot of iris petal lengths? A. All I. versicolor petals are shorter than I. virginica petals. B. I. setosa petals have a broader range of lengths than the other two species. C. I. virginica petals tend to be the longest, and I. setosa petals tend to be the shortest of the three species. D. I. versicolor is a hybrid of I. virginica and I. setosa. C 2 Date: Create a function that calculates the empirical cumulative data function of an array. Use the function to calculate the ECDFs of the three species of Iris (you will need the following datasets: setosa_sepal_, versicolor_sepal_, and virginica_sepal_). Plot the ECDFs on a single axis. Code import pandas as pd import seaborn as sns import t as plt import numpy as np setosa = _csv("setosa_sepal_") versi = _csv("versicolor_sepal_") virg = _csv("virginica_sepal_") def ecdf(data): n = len(data) x=(data) y=e(1, n+1)/n return x,y versicolor_petal_length = versi["7"] setosa_petal_length = setosa["5.1"] virginica_petal_length = virg["6.3"] Page 1 of 6 This study source was downloaded by from CourseH on :05:58 GMT -05:00
Escuela, estudio y materia
- Institución
- STAT 361 Data Analysis - Yale University WORKSHEET
- Grado
- STAT 361 Data Analysis - Yale University WORKSHEET
Información del documento
- Subido en
- 30 de abril de 2023
- Número de páginas
- 6
- Escrito en
- 2022/2023
- Tipo
- Examen
- Contiene
- Preguntas y respuestas
Temas
-
stat 361 data analysis yale university worksheet 37 statistical thinking in python