Examen
TextAnalytics_Week3_NEC_solved
Puntuación
Vendido
-
Páginas
5
Grado
A+
Subido en
18-04-2023
Escrito en
2022/2023
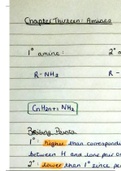
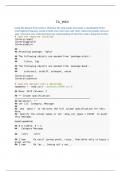
Using the dataset from week 2, eliminate the stop words and create a visualization of the highest frequency words in both a bar chart and a pie chart. Label your graphs and your axes. Comment your code showing your understanding of what the code is doing line by line.
Mostrar más
Leer menos
Institución
Text Analytics
Grado
Text Analytics
Ups! No podemos cargar tu documento ahora. Inténtalo de nuevo o contacta con soporte.
Libro relacionado
Text Mining with R
- 2017
- 9781491981658
- Desconocido
Escuela, estudio y materia
- Institución
- Text Analytics
- Grado
- Text Analytics
Información del documento
- Subido en
- 18 de abril de 2023
- Archivo actualizado en
- 18 de julio de 2023
- Número de páginas
- 5
- Escrito en
- 2022/2023
- Tipo
- Examen
- Contiene
- Preguntas y respuestas
Temas
-
textanalyticsweek3necsolved
$10.99
Accede al documento completo:
¿Documento equivocado? Cámbialo gratis
Dentro de los 14 días posteriores a la compra y antes de descargarlo, puedes elegir otro documento. Puedes gastar el importe de nuevo.
Escrito por estudiantes que aprobaron
Inmediatamente disponible después del pago
Leer en línea o como PDF
Documento también disponible en un lote
Package deal
TextAnalytics_NEC_All_Weeks_Solved
1
13
2023
$ 142.87
Más información