1. Experimental drug X is being tested for the treatment of stage IV
solid tumour malignancies. Part of the drug company's evaluation
process is to analyse survival data after 3 months of treatment. The
results are given in the table below .
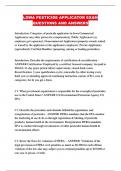
Treated with drug X Treated with placebo
Alive 20 38
Dead 60 38
Which of the following best represents the number needed to harm
for drug X?
A. 2
B. 3
C. 4
D. 7
E. 9
Answer: C
Explanation:
Unfortunately, not all interventions end up helping patients. The
number needed to harm (NNH) represents the
numberofpeoplethatmustbetreatedforoneadverseeventtooccur.
Itiscalculatedinamannersimilarto the number needed to treat (NNT)
but using the attributable risk instead of the absolute risk
reduction:
NNH = 1 I Attributable risk
To determine the attributable risk, first calculate the adverse event
rates in the treatment and placebo groups.
,Adverse event rate in treatment group = = 0.75 Adverse
event rate in placebo group = = 0.50
The attributable risk can then be calculated by subtracting the
event rate in the control group from the event rate in the treatment
group:
Attributable risk = Event rate,,..,..,.- Event rate,_,,, Attributable risk=
0.75 - 0.50 = 0.25
The absolute risk increase attributable to the treatment is 0.25. That
is, patients treated with drug X have a 25% absolute increased risk
of being dead at 3 months over patients on placebo. The NNH then
is simply the multiplicative inverse of the attributable risk:
NNH = 1 I Attributable risk NNH = 1 I 0.25 = 4
The result indicates that for every 4 patients treated with drug X, 1
will experience an adverse event (in this case, death). This drug will
likely not get very far in the approval process!
2. A study evaluated the role of ACE inhibitors in the prevention of
coronary events in diabetic patients. During five years of follow-up,
120 diabetic patients out of 400 who had taken an ACE inhibitor
developed an acute coronary event. Over The Same time,100
diabetic patients out of 300 who had not taken an ACE inhibitor
,experienced coronary events. What is the relative risk of
developing a coronary event in diabetic patients taking ACE
inhibitors compared to diabetic patients who are not taking ACE
inhibitors?
A. 120x200/100x280
B. 120x280/100x200
C. 120x100/280x200
D. (120/220)/(280/480)
E. (120/400)/(100/3000
Answer: E
Explanation:
It is important to know how to calculate some basic measures of
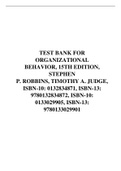
effect when given raw data. The first step is to organise the data
into a 2x2 table as shown below .
Coronary No coronary
event event
ACE inhibitor 120(a) 280(b) 400
No ACE 100(c) 200(d) 300
inhibitor
220 480 700
Relative risk is calculated for cohort studies using the following
formula:
RR = [a/(a+b)] / [c/(c+d}] = (120/400)/(100/300) = 0.90.
Odds ratio is calculated using the following formula: OR = ad/be
(Choice A}.
, 3. A study is conducted assessing the relationship between
smoking status and the forced expiratory flow between 25% and
75% of vital capacity (FEF) in 4 groups. Group A consists of 200
nonsmokers, group B consists of 200 light smokers (1-7 cigarettes
per day), group C consists of 200 moderate smokers (8-22
cigarettes per day), and group D consists of 200 heavy smokers
(23+ cigarettes per day). FEF is measured in all participants. Which
of the following is the most appropriate statistical method to
compare the FEFzs results among all 4 groups?
A. Analysis of variance
B. Chi-square test
C. Meta-analysis
D. Multiple linear regression
E. Pearson correlation coefficient
F. Two-sample test
Answer: A
Explanation:
solid tumour malignancies. Part of the drug company's evaluation
process is to analyse survival data after 3 months of treatment. The
results are given in the table below .
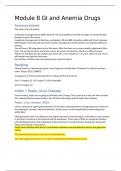
Treated with drug X Treated with placebo
Alive 20 38
Dead 60 38
Which of the following best represents the number needed to harm
for drug X?
A. 2
B. 3
C. 4
D. 7
E. 9
Answer: C
Explanation:
Unfortunately, not all interventions end up helping patients. The
number needed to harm (NNH) represents the
numberofpeoplethatmustbetreatedforoneadverseeventtooccur.
Itiscalculatedinamannersimilarto the number needed to treat (NNT)
but using the attributable risk instead of the absolute risk
reduction:
NNH = 1 I Attributable risk
To determine the attributable risk, first calculate the adverse event
rates in the treatment and placebo groups.
,Adverse event rate in treatment group = = 0.75 Adverse
event rate in placebo group = = 0.50
The attributable risk can then be calculated by subtracting the
event rate in the control group from the event rate in the treatment
group:
Attributable risk = Event rate,,..,..,.- Event rate,_,,, Attributable risk=
0.75 - 0.50 = 0.25
The absolute risk increase attributable to the treatment is 0.25. That
is, patients treated with drug X have a 25% absolute increased risk
of being dead at 3 months over patients on placebo. The NNH then
is simply the multiplicative inverse of the attributable risk:
NNH = 1 I Attributable risk NNH = 1 I 0.25 = 4
The result indicates that for every 4 patients treated with drug X, 1
will experience an adverse event (in this case, death). This drug will
likely not get very far in the approval process!
2. A study evaluated the role of ACE inhibitors in the prevention of
coronary events in diabetic patients. During five years of follow-up,
120 diabetic patients out of 400 who had taken an ACE inhibitor
developed an acute coronary event. Over The Same time,100
diabetic patients out of 300 who had not taken an ACE inhibitor
,experienced coronary events. What is the relative risk of
developing a coronary event in diabetic patients taking ACE
inhibitors compared to diabetic patients who are not taking ACE
inhibitors?
A. 120x200/100x280
B. 120x280/100x200
C. 120x100/280x200
D. (120/220)/(280/480)
E. (120/400)/(100/3000
Answer: E
Explanation:
It is important to know how to calculate some basic measures of
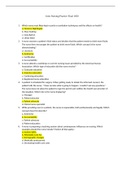
effect when given raw data. The first step is to organise the data
into a 2x2 table as shown below .
Coronary No coronary
event event
ACE inhibitor 120(a) 280(b) 400
No ACE 100(c) 200(d) 300
inhibitor
220 480 700
Relative risk is calculated for cohort studies using the following
formula:
RR = [a/(a+b)] / [c/(c+d}] = (120/400)/(100/300) = 0.90.
Odds ratio is calculated using the following formula: OR = ad/be
(Choice A}.
, 3. A study is conducted assessing the relationship between
smoking status and the forced expiratory flow between 25% and
75% of vital capacity (FEF) in 4 groups. Group A consists of 200
nonsmokers, group B consists of 200 light smokers (1-7 cigarettes
per day), group C consists of 200 moderate smokers (8-22
cigarettes per day), and group D consists of 200 heavy smokers
(23+ cigarettes per day). FEF is measured in all participants. Which
of the following is the most appropriate statistical method to
compare the FEFzs results among all 4 groups?
A. Analysis of variance
B. Chi-square test
C. Meta-analysis
D. Multiple linear regression
E. Pearson correlation coefficient
F. Two-sample test
Answer: A
Explanation: