

DATA SCIEN 2020Predictive Modeling Project
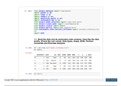
In [205]: from ets import load_boston import pandas as pd import numpy as np import seaborn as sns import t as plt import as sm from _selection import train_test_split from r_model import LinearRegression from er import KMeans from cs import mean_squared_error from ers_influence import variance_inflation_fac tor import math 1.1. Read the data and do exploratory data analysis. Describe the data briefly. (Check the null values, Data types, shape, EDA). Perform Univariate and Bivariate Analysis. In [88]: df = _csv("cubic_") () In [89]: () Out[88]: Unnamed: 0 carat cut color clarity depth table x y z price 0 1 0.30 Ideal E SI1 62.1 58.0 4.27 4.29 2.66 499 1 2 0.33 Premium G IF 60.8 58.0 4.42 4.46 2.70 984 2 3 0.90 Very Good E VVS2 62.2 60.0 6.04 6.12 3.78 6289 3 4 0.42 Ideal F VS1 61.6 56.0 4.82 4.80 2.96 1082 4 5 0.31 Ideal F VVS1 60.4 59.0 4.35 4.43 2.65 779 Create PDF in your applications with the Pdfcrowd HTML to PDF API PDFCROWD In [90]: In [91]: ibe(include="all").transpose() In [92]: () Out[89]: Unnamed: 0 Unnamed: 0 carat cut color clarity clarity depth table x y z price .11 Premium G SI1 62.3 58.0 6.61 6.52 4.09 5408 .33 Ideal H IF 61.9 55.0 4.44 4.42 2.74 1114 .51 Premium E VS2 61.7 58.0 5.12 5.15 3.17 1656 .27 Very Good F VVS2 61.8 56.0 4.19 4.20 2.60 682 .25 Premium J SI1 62.0 58.0 6.90 6.88 4.27 5166
Información del documento
- Subido en
- 16 de marzo de 2023
- Número de páginas
- 82
- Escrito en
- 2022/2023
- Tipo
- Presentación
- Personaje
- Desconocido

