12
Do not write
outside the
box
Section B The changing economic world
Answer all questions in this section.
Question 2 The changing economic world
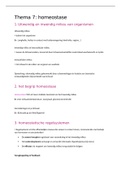
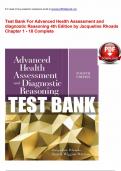
Study Figure 6, a diagram showing countries and their share of world trade.
Figure 6
Key
Region of the world
Africa Europe
Hong Kong Thailand Australia Asia
Singapore 0.42% 0.59%
Latin America North America
0.42% and Caribbean
Malaysia Other countries
0.41% South Middle East
Korea
Philippines 1.89%
0.39% UK
Pakistan
3.29%
0.36%
Bangladesh China Germany
0.32% 15.86% 4.65% Sweden
Russia
1.93%
0.64%
Saudi Arabia
0.91% France
Belgium
3.24% 0.62%
Iran Italy
Japan
0.53% Spain 2.42% Austria
5.79% India 1.66% 0.53%
UAE
Ne 1.
3.18%
th 06
0.48% Norway
er %
la
0.51%
nd
Israel
s
Indonesia Sw
0.43% 1.21% erl itz- Turkey Ireland
0.8 and 0.89%
Brazil USA 2% 0.44%
Po
Chile 2.18%
0.35%
23.89% 0. lan
68 d
Denmark
% 0.41%
99 a
Mexico Finland
1. nad
%
Colombia 1.43% 0.32%
Ca
0.38% Nigeria
0.46%
Argentina South Africa
0.60% Other countries stra
lia 0.46%
Au 67% Egypt
8.98% 1 .
0.29%
Source: howmuch.net
0 2 . 1 Using Figure 6, what is Mexico’s share of world trade?
[1 mark]
_______________________________ %
0 2 . 2 Using Figure 6, what is the difference between China and the USA’s share of
world trade?
[1 mark]
_______________________________ %
(12)
G/Jun20/8035/2
, 13
Do not write
outside the
box
0 2 . 3 Outline the limitations of economic measures of development.
[3 marks]
_______________________________________________________________________________
_______________________________________________________________________________
_______________________________________________________________________________
_______________________________________________________________________________
_______________________________________________________________________________
_______________________________________________________________________________
0 2 . 4 Explain how physical and economic factors have caused uneven development.
[4 marks]
_______________________________________________________________________________
_______________________________________________________________________________
_______________________________________________________________________________
_______________________________________________________________________________
_______________________________________________________________________________
_______________________________________________________________________________
_______________________________________________________________________________
_______________________________________________________________________________
Extra space ___________________________________________________________________
_______________________________________________________________________________
_______________________________________________________________________________
_______________________________________________________________________________
Question 2 continues on the next page
Turn over 8
(13)
G/Jun20/8035/2
Do not write
outside the
box
Section B The changing economic world
Answer all questions in this section.
Question 2 The changing economic world
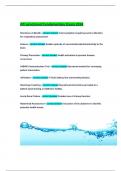
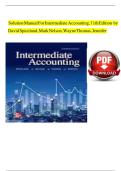
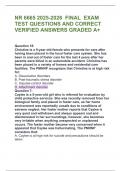
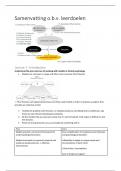
Study Figure 6, a diagram showing countries and their share of world trade.
Figure 6
Key
Region of the world
Africa Europe
Hong Kong Thailand Australia Asia
Singapore 0.42% 0.59%
Latin America North America
0.42% and Caribbean
Malaysia Other countries
0.41% South Middle East
Korea
Philippines 1.89%
0.39% UK
Pakistan
3.29%
0.36%
Bangladesh China Germany
0.32% 15.86% 4.65% Sweden
Russia
1.93%
0.64%
Saudi Arabia
0.91% France
Belgium
3.24% 0.62%
Iran Italy
Japan
0.53% Spain 2.42% Austria
5.79% India 1.66% 0.53%
UAE
Ne 1.
3.18%
th 06
0.48% Norway
er %
la
0.51%
nd
Israel
s
Indonesia Sw
0.43% 1.21% erl itz- Turkey Ireland
0.8 and 0.89%
Brazil USA 2% 0.44%
Po
Chile 2.18%
0.35%
23.89% 0. lan
68 d
Denmark
% 0.41%
99 a
Mexico Finland
1. nad
%
Colombia 1.43% 0.32%
Ca
0.38% Nigeria
0.46%
Argentina South Africa
0.60% Other countries stra
lia 0.46%
Au 67% Egypt
8.98% 1 .
0.29%
Source: howmuch.net
0 2 . 1 Using Figure 6, what is Mexico’s share of world trade?
[1 mark]
_______________________________ %
0 2 . 2 Using Figure 6, what is the difference between China and the USA’s share of
world trade?
[1 mark]
_______________________________ %
(12)
G/Jun20/8035/2
, 13
Do not write
outside the
box
0 2 . 3 Outline the limitations of economic measures of development.
[3 marks]
_______________________________________________________________________________
_______________________________________________________________________________
_______________________________________________________________________________
_______________________________________________________________________________
_______________________________________________________________________________
_______________________________________________________________________________
0 2 . 4 Explain how physical and economic factors have caused uneven development.
[4 marks]
_______________________________________________________________________________
_______________________________________________________________________________
_______________________________________________________________________________
_______________________________________________________________________________
_______________________________________________________________________________
_______________________________________________________________________________
_______________________________________________________________________________
_______________________________________________________________________________
Extra space ___________________________________________________________________
_______________________________________________________________________________
_______________________________________________________________________________
_______________________________________________________________________________
Question 2 continues on the next page
Turn over 8
(13)
G/Jun20/8035/2