Statistics 1 Most important goal inferential statistics:
Summary – exam 20 dec 2017
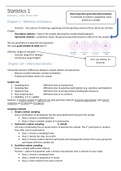
To estimate or predict a population value
based on a sample
Chapter 1 – Definition of Statistics
- Statistics – the science of collecting, organizing and interpreting numerical facts, which we call data
2 types
- Descriptive statistics – data of the sample described by numbers/tables/graphs
- Inferential statistics – predictions about the general population based on data from the sample
We use parameters to describe the population
We need good (reliable & valid) data!!!
Different ranges of variables
- Discrete range (# of siblings)
- Continuous range (height)
if it’s not infinite, it’s
discrete!
Chapter 2/3 – Inferential statistics
Inferential statistics: differences between sample statistic and parameter
- Natural variation between samples (reliability)
- Problems/mistakes within the sample
Sample risk
1. Sampling error difference due to randomness
2. Sampling bias difference due to selective participation (e.g. voluntary participation)
3. Response bias difference due to wrong answers/inadequate measures
4. Non-response bias difference due to no answers
1 = reliability, 2 3 4 = validity
Solution: A random sample of sufficient size that generates data for everyone approached, with correct
responses on all items for all subjects.
Sampling methods
1. Simple random sampling
every combination of participants has the same likelihood to become the sample
• Step 1: choose a sampling frame
• Step 2: draw a random sample of n participants
2. Systematic random sampling (= dated)
not every combination has an equal chance to become the sample. The 1st participant is random,
than after every k participants
• Step 1: choose a sampling frame
• Step 2: decide the step size k=N/n
• Step 3: choose random the first participant and subsequently choose from every group the
participant with this number (k)
3. Stratified random sampling
Draw a sample within each stratum.
Stratum = subset of population with a certain characteristic that is relevant to your study
• Step 1: choose a sampling frame
• Step 2: divide the population in strata
• Step 3: draw random from every stratum
, 4. Cluster sampling
Draw a random sample of clusters
• Step 1: choose a sampling frame
• Step 2: divide the population in clusters
• Step 3: draw random a number of clusters
• Step 4: choose all subjects of these clusters
5. Multi-stage sampling
combination of 1-4 (this example is combo of simple random sampling & cluster sampling):
• Step 1: choose a sampling frame
• Step 2: divide the population in clusters
• Step 3: Draw random a number of clusters
• Step 4: draw random participants of these clusters
• A good and well know example is PISA – education level of 15 y/o in different countries
o Simple random schools, students
o Stratified school characteristics
o Cluster geographical location
o Multi-stage 1. schools, 2. Students
Chapter 2/3 – Descriptive statistics
3 dimensions are important
- Central tendency (typical observation)
- Spread/dispersion/variability (variability in observations)
- Position (relative position of observations)
Categorical variables
Usually presented in
- table with frequency distribution
- bar graph
o Central tendency measure = mode “most frequent value”
o Variability measure = variance ratio
Quantitative univariate variable
- Table with frequency distribution
- Histogram
- Stem-and-leaf plot
o Central tendency measures average “sum observations/n”
median “value of observation in the middle”
Mode “most frequent observation”
o Variability measures range “difference between maximum and minimum”
standard deviation “a measure for the typical spread in the data”
interquartile range “difference between Q3 and Q1”
o Position measures percentile/quartile/minimum & maximum/median/z-score
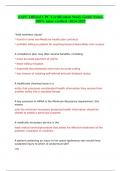
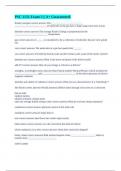
Boxplot explained
- Middle line = median
- Upper & lower whisker (----|) = upper & lower 25%
- “box” = middle 50%
- edges box = upper quartile value & lower quartile value
- dot = outlier
, Bivariate statistic
Ø Bivariate statistics reflect the degree of association between two variables
- Table/figure
o 2 categorical variables: contingency table
o 2 quantitative variables: scatter plot
- Measures
o 2 categorical variables: relative risk and odds ratio
o 2 quantitative variables: covariance, correlation and regression coefficient
Chapter 4 – Probability distribution
Probability rules
- p(A)
- p(not A) = 1 – p(A)
- p(A or B) = p(A) + p(B)
- p(A and B) = p(A) x p(B given A) probability that both A AND B will occur
o p(A and B) = p(A) x p(B) if A and B are independent
Discrete & continuous probability distributions
- Discrete (= finite set of possible values)
o e.g. what do you think is the ideal number of children for a family?
o Probability for each of these separate values can be calculated
- Continuous (= infinite set of possible values)
o e.g. What is your average commuting time to work?
o Probability to intervals of values can be calculated
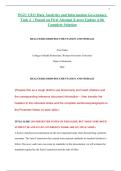
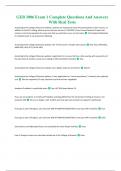
3 main distributions
1. Population distribution
o Definition: statement of all different values that a particular variable can have & the
frequency with which they make up a population that is observed/expected to be observed
o Example – dutch female height
§ Mean µ
§ Standard deviation s
§ Size N
2. Sample distribution
o Definition: statement of all different values that a particular variable can have & the
frequency with which they make up a sample that is actually observed
o Example – dutch female height
§ Mean 𝑦
§ Standard deviation s
§ Size n
3. Sampling distribution
o Definition: the probability distribution for the sample proportion. Interpret as the result of
repeatedly draw a sample of size n.
o Example – dutch female height
§ Mean 𝜇#
§ Standard deviation/error 𝜎#
§ Size ∞
Summary – exam 20 dec 2017
To estimate or predict a population value
based on a sample
Chapter 1 – Definition of Statistics
- Statistics – the science of collecting, organizing and interpreting numerical facts, which we call data
2 types
- Descriptive statistics – data of the sample described by numbers/tables/graphs
- Inferential statistics – predictions about the general population based on data from the sample
We use parameters to describe the population
We need good (reliable & valid) data!!!
Different ranges of variables
- Discrete range (# of siblings)
- Continuous range (height)
if it’s not infinite, it’s
discrete!
Chapter 2/3 – Inferential statistics
Inferential statistics: differences between sample statistic and parameter
- Natural variation between samples (reliability)
- Problems/mistakes within the sample
Sample risk
1. Sampling error difference due to randomness
2. Sampling bias difference due to selective participation (e.g. voluntary participation)
3. Response bias difference due to wrong answers/inadequate measures
4. Non-response bias difference due to no answers
1 = reliability, 2 3 4 = validity
Solution: A random sample of sufficient size that generates data for everyone approached, with correct
responses on all items for all subjects.
Sampling methods
1. Simple random sampling
every combination of participants has the same likelihood to become the sample
• Step 1: choose a sampling frame
• Step 2: draw a random sample of n participants
2. Systematic random sampling (= dated)
not every combination has an equal chance to become the sample. The 1st participant is random,
than after every k participants
• Step 1: choose a sampling frame
• Step 2: decide the step size k=N/n
• Step 3: choose random the first participant and subsequently choose from every group the
participant with this number (k)
3. Stratified random sampling
Draw a sample within each stratum.
Stratum = subset of population with a certain characteristic that is relevant to your study
• Step 1: choose a sampling frame
• Step 2: divide the population in strata
• Step 3: draw random from every stratum
, 4. Cluster sampling
Draw a random sample of clusters
• Step 1: choose a sampling frame
• Step 2: divide the population in clusters
• Step 3: draw random a number of clusters
• Step 4: choose all subjects of these clusters
5. Multi-stage sampling
combination of 1-4 (this example is combo of simple random sampling & cluster sampling):
• Step 1: choose a sampling frame
• Step 2: divide the population in clusters
• Step 3: Draw random a number of clusters
• Step 4: draw random participants of these clusters
• A good and well know example is PISA – education level of 15 y/o in different countries
o Simple random schools, students
o Stratified school characteristics
o Cluster geographical location
o Multi-stage 1. schools, 2. Students
Chapter 2/3 – Descriptive statistics
3 dimensions are important
- Central tendency (typical observation)
- Spread/dispersion/variability (variability in observations)
- Position (relative position of observations)
Categorical variables
Usually presented in
- table with frequency distribution
- bar graph
o Central tendency measure = mode “most frequent value”
o Variability measure = variance ratio
Quantitative univariate variable
- Table with frequency distribution
- Histogram
- Stem-and-leaf plot
o Central tendency measures average “sum observations/n”
median “value of observation in the middle”
Mode “most frequent observation”
o Variability measures range “difference between maximum and minimum”
standard deviation “a measure for the typical spread in the data”
interquartile range “difference between Q3 and Q1”
o Position measures percentile/quartile/minimum & maximum/median/z-score
Boxplot explained
- Middle line = median
- Upper & lower whisker (----|) = upper & lower 25%
- “box” = middle 50%
- edges box = upper quartile value & lower quartile value
- dot = outlier
, Bivariate statistic
Ø Bivariate statistics reflect the degree of association between two variables
- Table/figure
o 2 categorical variables: contingency table
o 2 quantitative variables: scatter plot
- Measures
o 2 categorical variables: relative risk and odds ratio
o 2 quantitative variables: covariance, correlation and regression coefficient
Chapter 4 – Probability distribution
Probability rules
- p(A)
- p(not A) = 1 – p(A)
- p(A or B) = p(A) + p(B)
- p(A and B) = p(A) x p(B given A) probability that both A AND B will occur
o p(A and B) = p(A) x p(B) if A and B are independent
Discrete & continuous probability distributions
- Discrete (= finite set of possible values)
o e.g. what do you think is the ideal number of children for a family?
o Probability for each of these separate values can be calculated
- Continuous (= infinite set of possible values)
o e.g. What is your average commuting time to work?
o Probability to intervals of values can be calculated
3 main distributions
1. Population distribution
o Definition: statement of all different values that a particular variable can have & the
frequency with which they make up a population that is observed/expected to be observed
o Example – dutch female height
§ Mean µ
§ Standard deviation s
§ Size N
2. Sample distribution
o Definition: statement of all different values that a particular variable can have & the
frequency with which they make up a sample that is actually observed
o Example – dutch female height
§ Mean 𝑦
§ Standard deviation s
§ Size n
3. Sampling distribution
o Definition: the probability distribution for the sample proportion. Interpret as the result of
repeatedly draw a sample of size n.
o Example – dutch female height
§ Mean 𝜇#
§ Standard deviation/error 𝜎#
§ Size ∞